A Sewing Machine for Fabric
Microsoft Fabric is an all-in-one analytics platform announced earlier this year that unifies Data Factory, Synapse and Power BI under one roof. With Tabular Editor, you can develop and manage Power BI datasets that are deployed to workspaces using Fabric dedicated capacity. The new capabilities of Fabric and the features of Tabular Editor together will help you create effective datasets that enable users to make the most of their data.
The future of Power BI datasets in Fabric
Fabric brings many new capabilities and workloads that enhance the value organizations get from their data. Integral to many of these workloads are the semantic models you create by developing and deploying Power BI datasets. The new features and tools in Fabric will likely result in an increase of dataset creators, consumers and the number of datasets in an organization. In Fabric, having mature, scalable tools and processes to create, manage and audit datasets will be more important than ever.
The following diagram depicts reasons why creating quality datasets effectively will be more important in Microsoft Fabric.
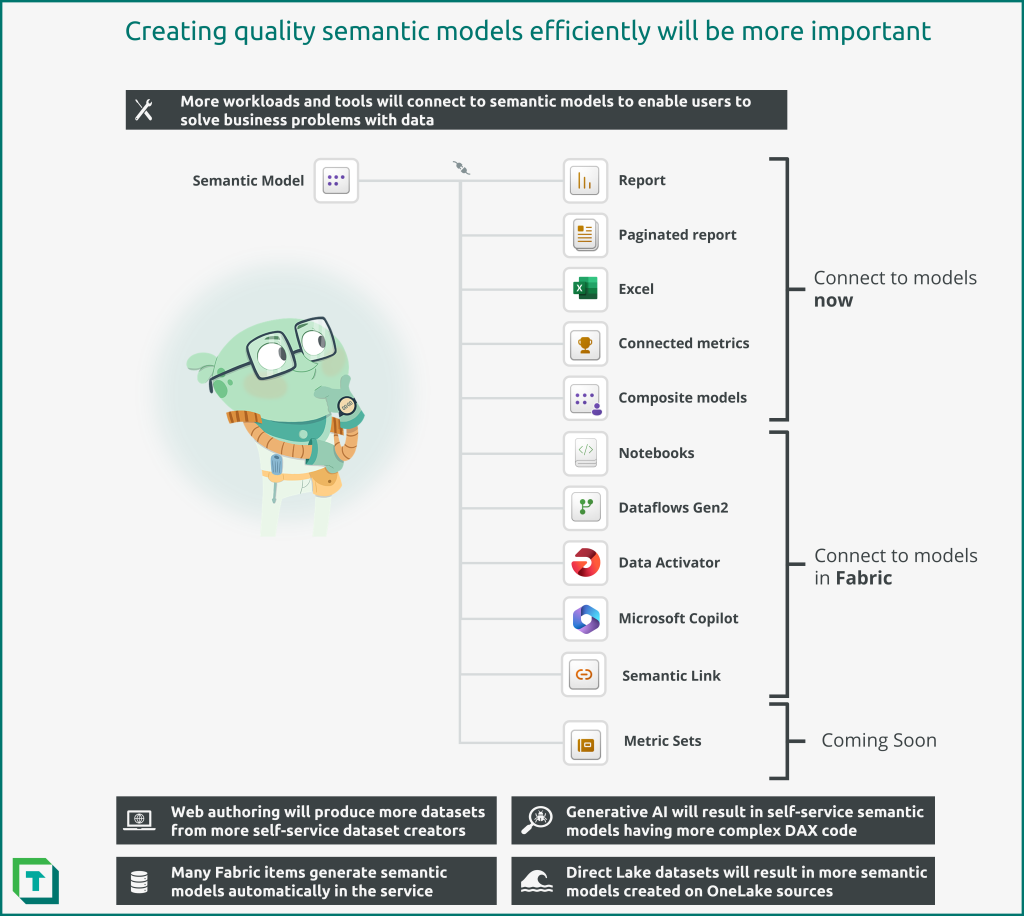
The following are reasons why Power BI datasets and semantic models will be more important in Fabric:
- More workloads and tools will connect to datasets to enable users to solve business problems with data
- Web authoring will produce more datasets from more self-service dataset creators
- Generative AI will result in self-service datasets having more complex DAX code
- Many Fabric data items generate default datasets automatically in the service
- Direct Lake datasets may result in more datasets created on OneLake sources

Curious about these characters? These little aliens are from SpaceParts Co., a spaceship parts distributor. SpaceParts Co. manage many Power BI datasets in Fabric. In the Tabular Editor Enterprise training, you’ll learn about how they effectively use Tabular Editor to make better datasets, faster. Additionally, you’ll get access to SpaceParts’ Data Warehouse to practice your data modeling skills in Tabular Editor for yourself. This sample dataset is also useful for practicing DAX, learning Fabric, and experimenting with Data Visualization!
Power BI datasets will have more impact in an organization
In Fabric, Power BI datasets will be more important for your organization than ever before. That’s because Fabric introduces new data items and workloads that consume Power BI datasets as a data source. To get the most value from Fabric, you should ensure robust, scalable tools and processes to develop and support both self-service and enterprise data models.
Tools and items that consume Power BI datasets in Fabric include:
- Reports: Both interactive and paginated reports use Power BI datasets to visually present and analyze data in datasets with DAX queries.
- Excel: Still the most common tool to consume data, Excel can connect to Power BI datasets either using MDX queries with Analyze in Excel or DAX queries with live connected tables.
- Scorecards / Metrics: Scorecards are useful for users to track their personal metrics against targets for key business objectives, which rely on datasets (either existing datasets for connected metrics or generated datasets for manual metrics).
- Composite models: Users can enrich subsets of existing, central datasets with additional information by creating composite models. Composite models help central BI teams preserve a single truth, while enabling business users to enrich the model with additional data and logic. However, these models have a wide range of considerations that are important to know before endorsing this method for self-service users.
- Notebooks (Semantic Link): New in Fabric, analysts and data scientists can connect to Power BI datasets from Notebooks to analyze, visualize and even enrich data (via outputting to OneLake – or writeback – for Direct Lake datasets). These users leverage Power BI datasets because the datasets contain re-usable business logic in the form of model relationships and DAX measures. This business logic is essential for analysts and data scientists to do their work. It’s thus critical that these users have timely access to quality data models to enable them to produce valuable analyses and machine learning (ML) models.
- Dataflows Gen2: New in Fabric, Dataflows Gen2 (Dfg2) can connect to Power BI datasets using the Analysis Services connector and schedule outputs to different destinations. While not a best practice as it duplicates information, self-service users may use this approach to create snapshots of datasets or automate testing to known baselines with a no-code tool.
- Data Activator: While not yet available, Data Activator is a separate workload in Fabric that will enable data-driven alerting and automation capabilities.
- Copilot Plugins: Another Fabric feature that is not yet available, Copilot promises the ability of users to interrogate data using natural language queries and generative AI. These experiences are poised to revolutionize how business users engage with and use data, opening new avenues for effectiveness… if the data supports it. Innovating with these Copilot experiences will require robust, quality, organized models that follow best practices and are rigorously tested.
Power BI datasets will become more prevalent, with more users
Fabric will see more datasets being created, and more users connecting to those datasets with different tools. Datasets are in the strategic position to serve a central, preserved source of business logic; they will be semantic models for reporting and analytics experiences.
The following are examples of why Power BI datasets may become more abundant in Fabric:
- Default datasets: Fabric items like Lakehouses, Data Warehouses and Datamarts generate default datasets. These datasets are created automatically so that you can quickly explore data with Power BI Reports, Notebooks or client tools. As more of these items are created, more default datasets will be produced. Managing these datasets will be important if they are used for downstream reporting or analytics.
- Direct Lake datasets: The ease with which users can add data to OneLake and explore it with Direct Lake datasets – even from My Workspace – may lead to an increase in the prevalence of Personal BI and Prototyping Power BI usage scenarios. As more users store data in OneLake, more Power BI datasets will be created to explore and analyze this data.
- Web authoring: Users can create and modify Power BI datasets from the browser by using the Power BI service. This opens dataset authoring to whole new populations of users who otherwise couldn’t use Power BI Desktop, before. Increasing the number of users who can author datasets will invariably lead to more datasets in general, over time.
- Git integration: In Fabric, workspace-level Git integration enables source control of datasets and other supported items. This Git integration facilitates developer collaboration. Different developers can work on different datasets, committing their changes to separate working branches of the solution repository. Then, when ready, developers can merge these chains to the main branch. Git integration can result in more datasets as developers collaborate. Additionally, it may lead to more development teams adopting lifecycle management with datasets staged across Development, Test and Production workspaces by using deployment pipelines.
- New personas: With Notebooks, Data Scientists can easily connect to and leverage the business logic in Power BI datasets for their analyses and models. This is an entirely new user population that previously couldn’t easily connect to and benefit from datasets. Furthermore, these users can write their outputs back to OneLake, which can be immediately visible in Direct Lake datasets and connected reports. This native writeback functionality enables a number of exciting use-cases, such as simplifying implementation of basic predictive analytics in Power BI reporting.
Managing and supporting Power BI datasets will become more complex
Many new features in Fabric create additional options to connect to, transform and analyze data. Furthermore, generative AI lowers the threshold for users to leap into more complex data modeling and analysis. As such, datasets deployed to Microsoft Fabric will grow in complexity over time.
The following are examples of reasons why managing datasets will be more complex in Fabric:
- More options: With Fabric, it’s now possible to have datasets with import, Direct Query, hybrid, and now Direct Lake storage mode. Each of these storage modes have their own use-cases and considerations. Managing these datasets will require a good understanding of their use-cases, considerations and limitations.
- More datasets: As described in the previous section, Fabric will likely result in more datasets in an organization’s tenant. Supporting and managing these datasets requires robust tools and techniques. Programmatic management and optimization of datasets will be essential, for example by scanning datasets with the Best Practice Analyzer.
- AI-driven DAX: Copilots and other generative AI tools will help self-service content creators write more sophisticated DAX expressions for measures, calculated columns and calculated tables. However, these AI tools will not be a replacement for core theoretical knowledge and critical thinking. Generative AI can produce code flawed in its performance or approach, as it will never perfectly understand or interpret the author’s intent and the full extent of their code’s use cases. Pro tools and mature methods will be needed to effectively debug these expressions and support these datasets.
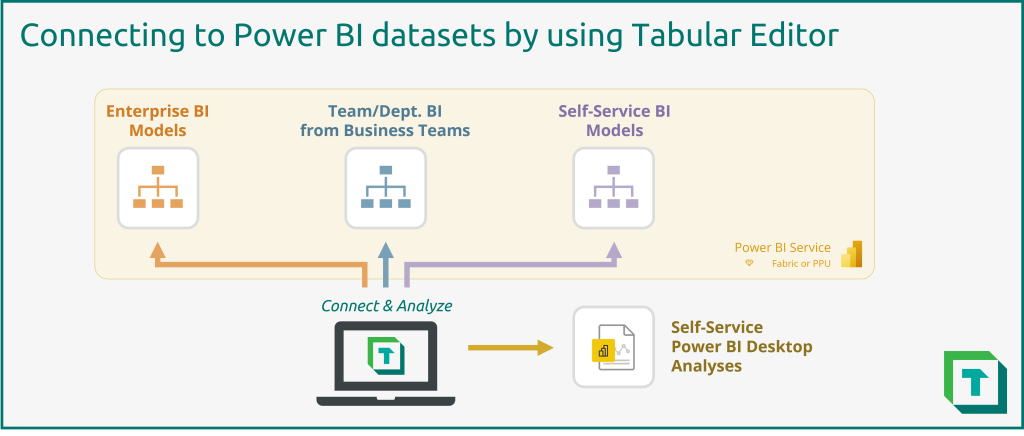
Tabular Editor can be a helpful tool for managing datasets deployed to Fabric. With Tabular Editor, you can connect to and manage different types of datasets from a single interface. This is ideal for supporting and auditing data models, such as in a managed self-service BI environment.
However, Tabular Editor has many other features which benefit not only support but also development of Power BI datasets.
Use-cases for Tabular Editor with Fabric
Tabular Editor helps you make better Power BI datasets, faster. This lets you leverage the new capabilities of Fabric, while benefiting from productivity enhancements in Tabular Editor. The following figure illustrates just some of the Tabular Editor features that help you develop and manage Power BI datasets.
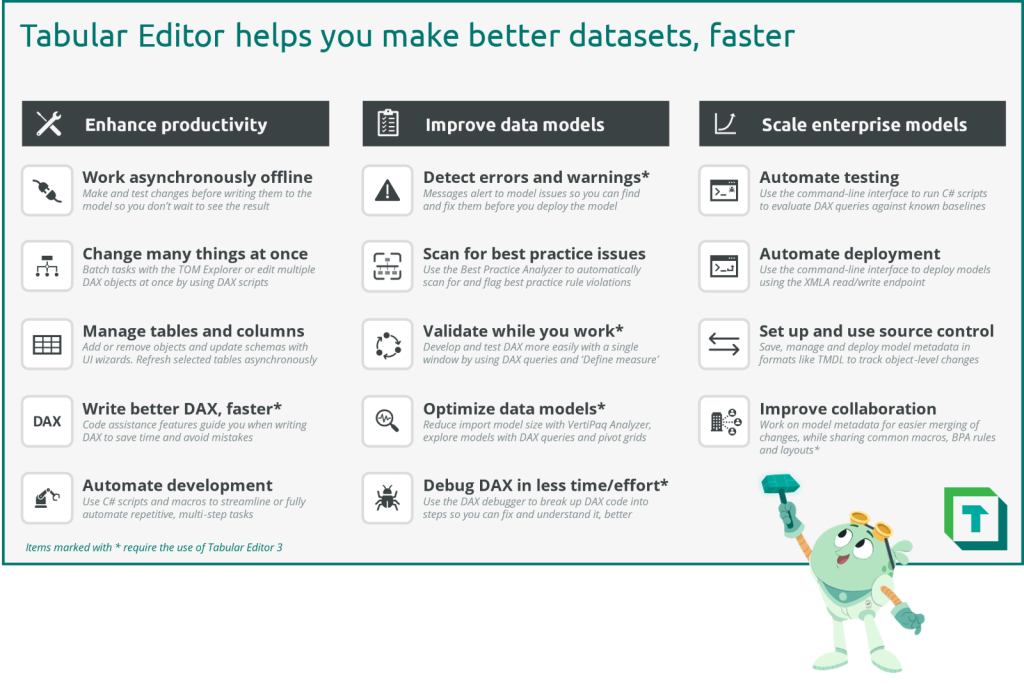
To summarize, Tabular Editor has many features that help you enhance productivity, improve your data models and scale enterprise models.
- Enhance productivity: Tabular Editor contains features that help you write DAX, manage your dataset and even automate and scale development, programmatically.
- Work asynchronously offline: With Tabular Editor, you work with an offline copy of the metadata, allowing you to make changes without waiting for a user interface or data model to process them. While working, you can still query remote models and submit operations to refresh tables or partitions.
- Change many things at once: Batching changes is straightforward in Tabular Editor, as you can select multiple objects and change common properties at once, instead of doing this individually. Tasks like organizing the model in display folders, setting format strings, or deleting objects are trivial and fast. Additionally, you can always undo any unintentional changes by pressing CTRL + Z.
- Manage tables and columns: While most people use Tabular Editor to manage DAX, you can also manage data tables and columns. In Tabular Editor, you can view and edit Power Query code, and even automatically detect schema changes in the data source. With the Table Import Wizard, you can add new tables from supported sources like Power BI dataflows, SQL Server (or Serverless Pools) and Databricks, as Tabular Editor automatically generates the appropriate Power Query code and metadata for you. Finally, you can refresh selected tables to view any changes, with the ability to track refresh performance in real-time or even cancel and pause refreshes with the user interface.
- Write better DAX, faster: Tabular Editor contains a suite of code assistance features that improve the DAX authoring experience. It highlights issues in the code, and provides informative pop-up windows to describe syntax rules, functions and suggestions.
- Automate development: Arguably the most powerful feature of Tabular Editor, C# scripts let you programmatically manage model metadata. These C# scripts can be used in the user interface or the command line interface (CLI) for CI/CD build and validation pipelines. In the user interface, scripts can be saved as macros to automate and streamline repetitive tasks, even if they are complex and involve multiple steps, such as:
- Improve data models: Many features in Tabular Editor are designed to help you perform QA/QC of data models, so they are more reliable and organized for model consumers.
- Detect errors and warnings: The messages window of Tabular Editor alerts you to problems in the model. Double-clicking these messages directly takes you to the issue so you can fix it.
- Scan for best practice issues: The Best Practice Analyzer (BPA) is fully integrated in Tabular Editor, letting you scan the model for best practice rule violations. You can create your own custom BPA rules tailored to your datasets and workflows, and even create automated “Fix Expressions” to fix these issues with the push of a button in Tabular Editor.
- Validate while you work: For complex DAX, you can create and test code iteratively from within the DAX query window using ‘Define Measure’. This lets you develop and validate DAX from a single pane before you write changes to the dataset.
- Optimize data models: Import datasets can be investigated with the VertiPaq Analyzer to identify which objects are taking the most space, referential integrity issues, among other things. Furthermore, you can interrogate model data using Preview Data, Pivot Grids and DAX Queries to validate the data itself and the model / DAX calculation logic.
- Debug DAX in less time/effort: Tabular Editor contains a DAX Debugger tool. This tool disassembles DAX expressions into their evaluation steps, letting you examine intermediate evaluations of variables and sub-expressions to both understand the code and investigate potential issues. The debugger is particularly powerful for complex DAX, or for learning key theoretical concepts like iterators and context transition.
- Scale enterprise models: Tabular Editor provides many features that help enterprise teams efficiently manage datasets, where they seek mature tools and robust methods to deliver quality analytics solutions.
- Automate testing: Using C# scripts and the BPA, teams can validate data models during CI/CD pipelines with the Tabular Editor CLI. This can be extended beyond enterprise datasets to also scan all the self-service datasets in a tenant to proactively identify and flag issues or outliers.
- Automate deployment: The Tabular Editor CLI can manage and deploy model metadata using the XMLA read/write endpoint.
- Setup and use source control: In both Fabric dedicated capacity and Pro shared capacity, Tabular Editor can help you enable source control. By managing model metadata and using the Power BI REST APIs, you can view and manage object-level changes in your data model.
- Improve collaboration: Since Tabular Editor works with model metadata formats like TMDL, .bim and database.json, it’s easier to collaborate with other developers on the same dataset. Using source control, you can manage and merge changes from different developers working on their own branches. This is further enhanced when you benefit from the Fabric Git integration of workspaces.
Making the most of Fabric with Tabular Editor
Many of the Tabular Editor features are further enhanced with the recent updates to Power BI. This is true not only for datasets deployed to Fabric dedicated capacity, but also datasets managed in Power BI Desktop (and deployed to Premium Per User or Pro shared capacities). The following diagram depicts some additional benefits of using Tabular Editor with these new Power BI features and updates.
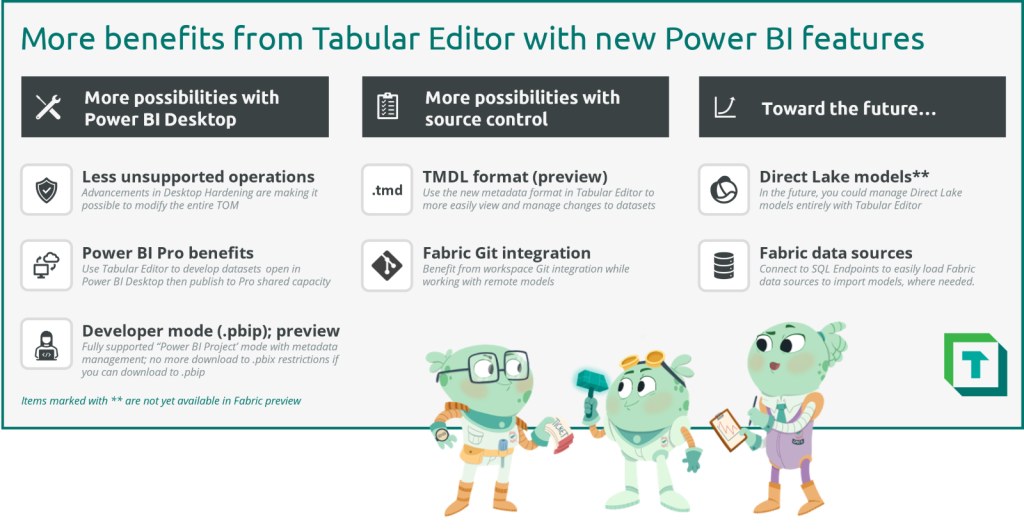
To summarize, recent and future updates to Power BI enable some exciting possibilities when using Tabular Editor to develop datasets.
More possibilities with Power BI Desktop
Tabular Editor can be used as a Power BI Desktop external tool for some years. This means that if you have a local model open in Power BI Desktop, you can connect to the local instance of Analysis Services to view and manage the model in Tabular Editor. This lets you benefit from all of Tabular Editor’s features, and even create objects that are supported by the Power BI Service but don’t (yet) have a user interface to create or manage them in Power BI Desktop.
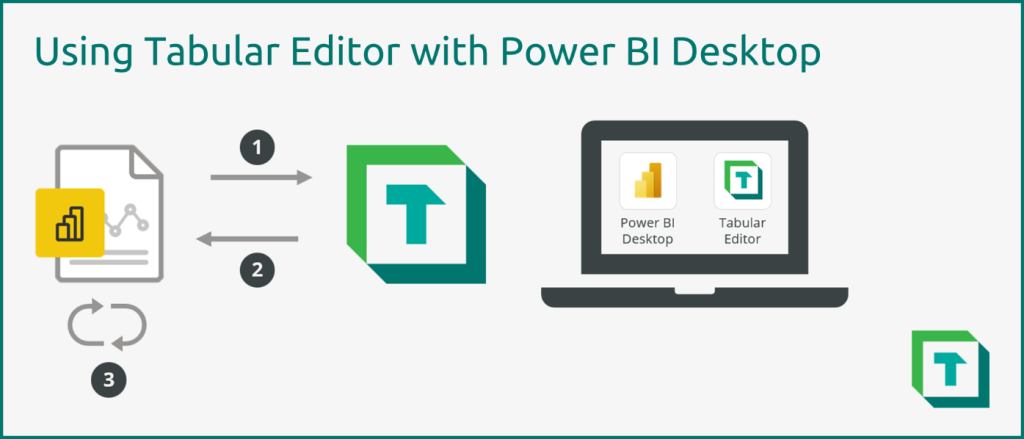
Using Tabular Editor as an external tool you connect to a local model open in Power BI Desktop by:
- Connecting to a local instance of Analysis Services to load the model metadata.
- Making changes in Tabular Editor and write these back to Power BI by pressing “Save”.
- Changes are visible in Power BI; similarly, changes in Power BI are also visible in Tabular Editor. The two views are always in sync.
The .pbix file format previously prevented changing many objects and properties of local models, including Power Query code, calculated tables/columns and data tables/columns. Additionally, when writing changes to a Power BI dataset deployed to Power BI Premium or Premium Per User, you were unable to download this dataset back to .pbix. However, these limitations seem to be gradually lifting with recent updates, as Power BI supports a standard model metadata format enabled by TMDL and the Power BI Project file type (.pbip) for pro development.
- Less unsupported operations: Thanks to these new updates, it’s now possible to modify virtually all properties of a local model. The only exception is partitions; Power BI Desktop does not yet support tables with custom partitioning.
- Power BI Pro benefits: Because of these updates, you can use Tabular Editor as an external tool to perform much more development. This lets you benefit from all Tabular Editor’s productivity and quality enhancement features without creating difficulties publishing your model with Power BI Desktop.
- Developer mode and Power BI projects file format (.pbip): All of this is in part enabled by the new initiative to support more “pro developer” usage scenarios with Power BI Desktop. The new .pbip file format provides a supported way to programmatically access and manage model (and eventually report) metadata.
The following diagrams depict how you use these Power BI projects files (.pbip) with Power BI Desktop and Tabular Editor.
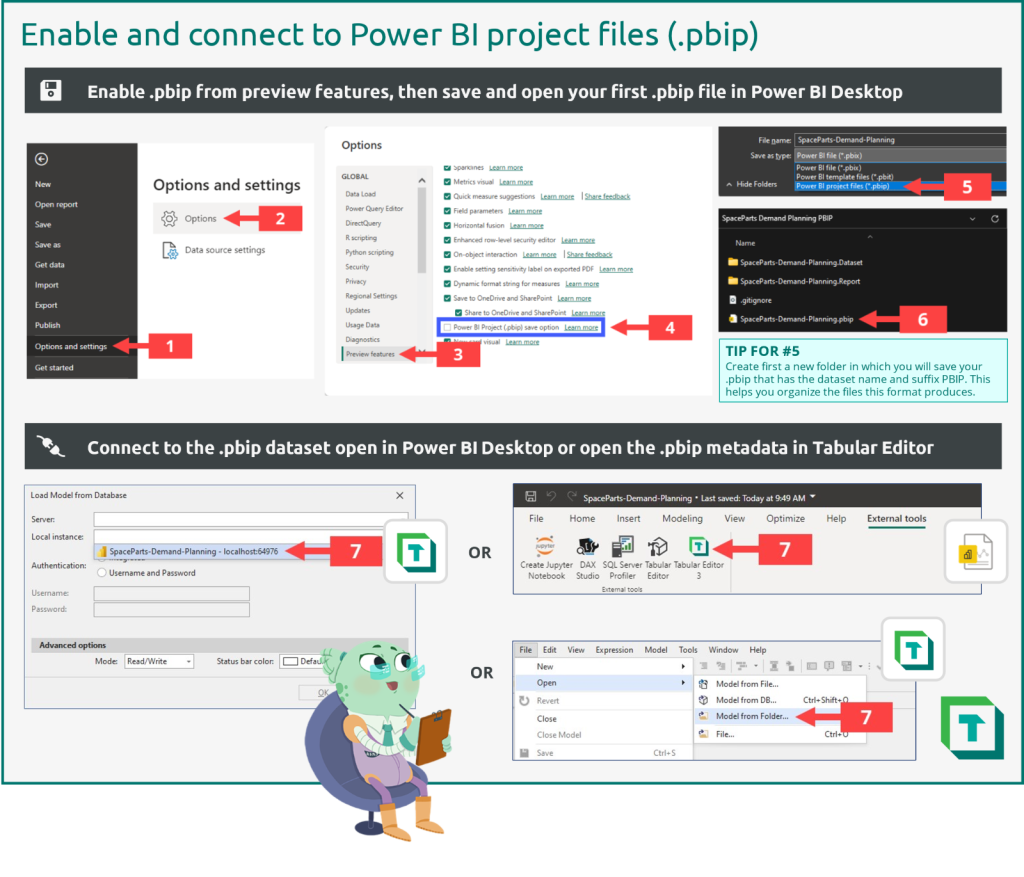
- Under the “File” menu in Power BI Desktop, find “Options and Settings”
- Select “Options”
- Navigate to “Preview features”
- Select “Power BI Project (.pbip) save option
- Save your dataset as the new .pbip format (Tip: create a folder to save the .pbip files into)
- Navigate to the saved file and open the .pbip in Power BI Desktop
- Connect to the local model open in Power BI Desktop either with Tabular Editor or the Power BI Desktop external tools ribbon
Once you’ve connected to the local model, you can continue development. The following diagram illustrates then how you work with the model in Tabular Editor, and the options available to deploy a .pbip file.
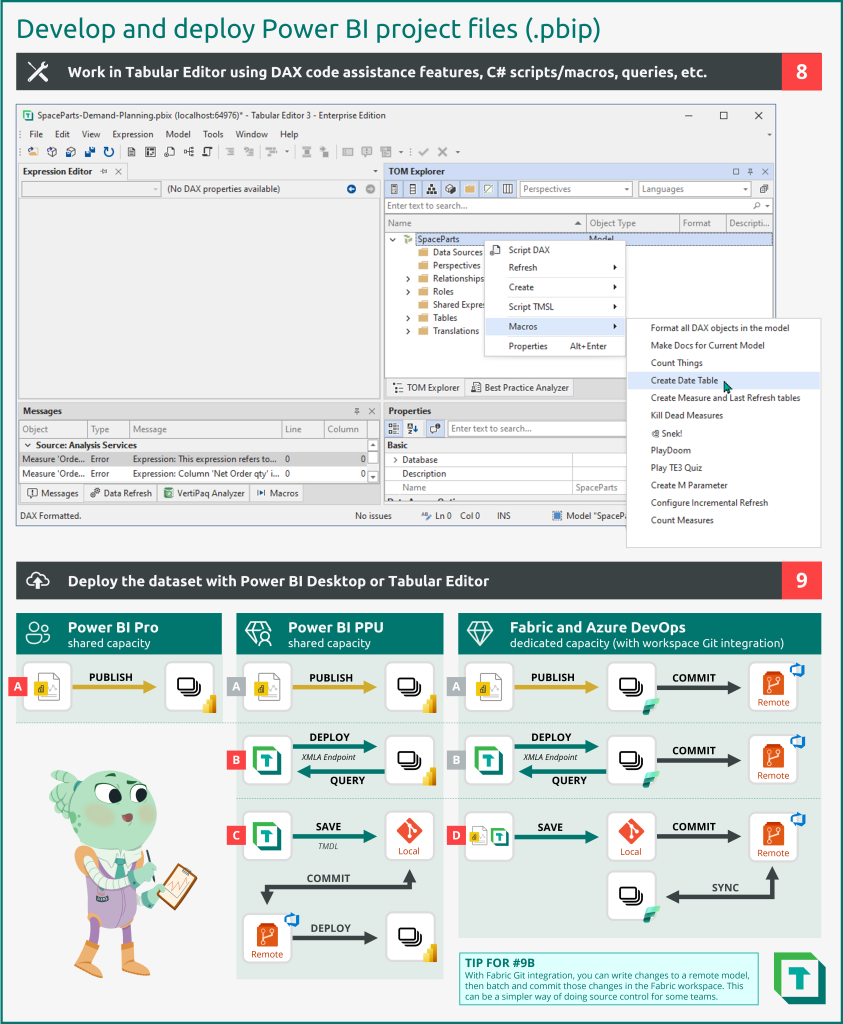
- Work in Tabular Editor, benefitting from the DAX code assistance features and productivity enhancements. With a .pbip file, many more write operations will be supported.
- Deploy the model once you are ready, using one of the supported methods:
- You can publish .pbip files from Power BI Desktop. This means that you can benefit from more features of Tabular Editor while using it as an external tool.
- You can deploy the model from Tabular Editor. You can also query remote models if you are using Tabular Editor 3.
- You can save and deploy model metadata. Formats like the Tabular Model Definition Language (TMDL) can be saved to source control and deployed programmatically to the workspace. With Tabular Editor 3’s workspace mode, you can simultaneously work in a model metadata format while connected to a remote model, so you can also query the model.
- You can save and deploy .pbip metadata. With Fabric Git integration, .pbip files saved to a remote repository can be synchronized with a supported Fabric workspace. Other deployment methods (A, B) can benefit from this Git integration as well, so that you can batch and commit changes within the Fabric service instead of using a source control management tool.
More possibilities with source control
As described in the previous sections, there have been tremendous effort put forward by the Power BI product teams to support pro developer usage scenarios. This work is of course not just limited to Power BI Desktop, but driven largely thanks to the new TMDL format and Fabric Git integration.
- TMDL format (preview): Thanks to the new TMDL format, source control of datasets is not only easier (as this is an official, supported, serialized metadata format) but better. The TMDL format is clean and easy to read, making it easier to manage and merge changes. The TMDL format is fully supported in Tabular Editor.
- Fabric Git integration: Long-awaited, official Git integration for Power BI now enables source control from within Fabric workspaces. This means that you can connect directly to remote models with Tabular Editor to make changes, staging and committing them directly in the Fabric service. This simplifies the source control process so that you don’t need to manage model metadata files; it’s automatically handled for you by Fabric integration with Azure DevOps.
Towards the future
Fabric is currently in preview. As such, Fabric is evolving quickly with new updates and feedback from the public preview. Additionally, best practices are not currently defined for many workloads, as they reach initial adoption with different organizations. However, we can anticipate some future use cases for Tabular Editor given the changes in Fabric.
- Direct Lake models: XMLA Read/Write endpoints currently aren’t supported for Direct Lake datasets. If and when they are enabled, however, this will allow you to manage these datasets like you manage import, hybrid and Direct Query models, today, in Tabular Editor.
- Fabric data sources: Many of the new data items in Fabric come with out-of-the-box SQL Endpoints to connect to and analyse the data in client tools. You can use these SQL Endpoints in the SQL Server connector of the Tabular Editor import table wizard to create new tables in import models. This can be beneficial for use-cases where you prefer to use import or hybrid storage modes over Direct Lake.
In conclusion
Fabric is poised to revolutionize analytics with a unified, elegant user experience and many powerful capabilities. The experiences and tools in Fabric rely on effective Power BI datasets, for enterprise, self-service and even personal BI usage scenarios. To improve and scale Power BI dataset development and management, you can use Tabular Editor. With Tabular Editor, you can develop better datasets, faster, and also effectively audit and support self-service datasets.

Pingback: Prepare your data for a semantic model – Tabular Editor Blog
Hi Kurt,
Thanks for the great content!
You had a note: “For managing datasets in Microsoft Fabric, you need Tabular Editor 3 Enterprise Edition.”
Currently TE2 supports editing remote models in the Power BI Service. Does this change mean that if Fabric will go from preview to GA then datasets hosted in Power BI Service will only be editable with TE3 Enterprise? (sounds a bit big leap to me)
Thank you,
Barna
Hi Barna
No, TE2 will still be able to access and modify dataset in both the Power BI and Fabric Service.
The note refers to which Tabular Editor 3 edition is required for accessing the semantic models.
Great content, thanks Kurt!
Can we have subscription system here in this blog so that we get the news posts automatically? If there is one, I couldnt find it.
Hi Halil
The RSS feed for the blog is available at https://blog.tabulareditor.com/feed/.
Hint, for WordPress blogs, you can always (unless turned off) add /feed to any url and get the RSS feed, even for specific categories etc.
BR David