Evaluate whether your data is ready for modelling or not.
A semantic model is a layer that provides meaning to data (semantic) by using objects, calculations, and logic (model) to represent a real-world process, like sales or pricing. A semantic model is a core component of Microsoft Fabric and Power BI; it’s one of the most important item types you manage in an end-to-end Fabric or Power BI solution as this is the primary way your end-users interacts with the data. It’s therefore important for you to know how to effectively design, build, and deploy good semantic models efficiently to meet business data needs.
In this series, we provide tips for how to effectively build a semantic model. In the previous article, we described key considerations to gather requirements for your semantic model.
In this article, we describe how you can connect and transform data when you build your model in Tabular Editor or Power BI Desktop.
Assess whether your data is ready for a semantic model
Before you start to build a semantic model, you should first evaluate whether the data is ready for modelling. Your objective here is to identify significant issues or challenges in the data that could cause problems and cost time once you proceed with the actual modelling.
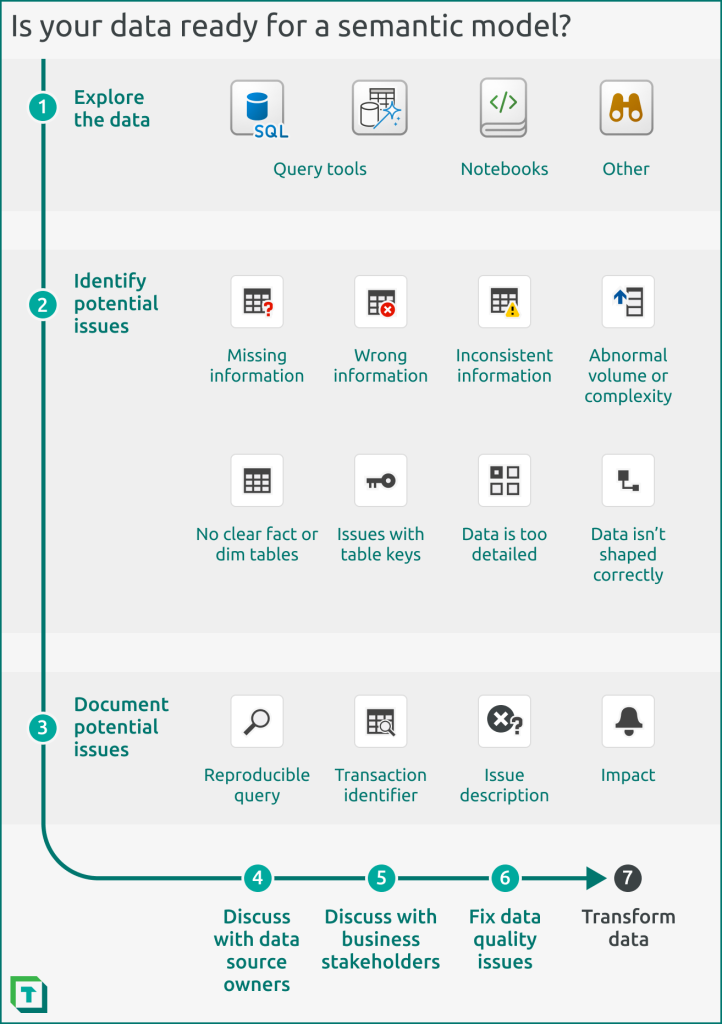
Step 1: Explore the data
To do this assessment, you should connect to and explore the data in a query tool, notebook, or simply opening and browsing the file (i.e. if it’s an Excel file or CSV). Depending on what you see, you may need to spend time transforming your data so you can make the best model from it.
Step 2: Identify potential issues
The following points are examples of warning signs that your data might not yet be ready to begin building your semantic model:
- There are no clear fact or dimension tables. For instance, you must compare sales to forecast, but cannot find the ‘Forecast’ table.
- A fact table has quantitative attributes that you aggregate, like sales.
- A dimension table has descriptive attributes that you use to aggregate data, like region.
- Important tables and columns are missing which you expect to be there. For instance, you have a requirement to exclude intercompany data in some measures, but have no attributes which identify intercompany transactions.
- There are no clear key fields to link dimension tables to fact tables. For instance, you can find no way to map the available customer attributes to the budget file, but the business expects the budget to be reported by customer.
- The keys in dimension tables don’t uniquely identify rows in those tables. For instance, you can only identify customers by a combination of their customer code, sales region, and sales channel (but you expected the customer code to be the key).
- The number of rows in the tables are significantly higher or lower than you expect in the final solution. For instance, you observe that the customers table has 12 billion records, or that the budget table has 12 records.
- The complexity, granularity (level of detail), or cardinality (number of unique values in a column) of the data is significantly higher or lower than you expect in the final solution. For instance, you observe that values are rounded to the nearest thousands, or that you have monthly data, when you expect daily data.
- There are unexpected empty (null) fields in the data. For instance, there are records in the ‘Sales’ table where the ‘Sales’[Customer Key] is null.
- There are unexpectedly large or small values. For instance, a record in the ‘Sales’ table has a ‘Sales’[Net Value] of 3 million USD.
- There are transactions that make no sense. For instance, a record in the ‘Orders’ table has a ‘Orders’[Delivery Date] before the ‘Orders’[Order Creation Date], or the ‘Orders’[Order Creation Date] is null.
- There is incongruity between the fields the business want (or what you need to calculate business metrics) and the fields you see in the data. For instance, the business want to report sales by customer key account, but you only see a column for “national account”. In another example, you need to calculate “adjusted gross sales” and you don’t know which of the columns in the ‘Sales’ table you need to do this.
Step 3: Document the issues
It’s common that your data isn’t in the shape you need for your semantic model. Rarely – if ever – do you proceed without adjusting, or even altering the model design. Once you’ve identified any potential data issues, you should take pro-active, follow-up actions.
After exploring the data, you should describe any issues you see with examples. Include the query you used to identify the issue, and the unique identifier from an example transaction. This helps you and others investigate, fix, and validate the issue. If feasible, you should also indicate why the issue is a problem, and what the potential impact is for the model and the overall solution.
Step 4: Discuss with the data source owner
If you are not the person who maintains the data source, then discuss these issues with this team or individual. For instance, if a separate team is maintaining the data warehouse and you are building the semantic model, they need to know this information, so that they can investigate data quality issues and make adjustments.
Step 5: Discuss with business stakeholders
You may need to (re-)align with business stakeholders. This is necessary mainly for data provided or maintained by the business, like a budget file. Meet with the business to discuss the issues, but ensure you have concrete examples and questions prepared. Don’t get too technical; just ensure that they can give you the clarity you need to proceed.
Step 6: Fix data quality issues (if feasible)
If you’ve identified issues with the quality of the data, this should be prioritized. Do what you can to resolve these issues, but be aware that some perceived data quality issues can actually reflect abnormalities in the underlying business process. Raise these issues to the appropriate people to understand if issues that you perceive as data quality are due to business process flaws or exceptions.
Here are some examples of issues you might perceive as being a data quality problem, but actually reflect a business process exception or flaw.
- In the ‘Price Changes’ table, the ‘Price Change’[Expiry Date] could be 01/01/2099.
- Quality? This may seem like a data quality issue, since it’s an unreasonable date.
- Process. This could be a placeholder date indicating that the price currently has no expiry; it is the current, active price.
- In the ‘Orders’ table, the ‘Orders’[Creation Date] is after the ‘Orders’[Requested Delivery Date].
- Quality? This may seem like a data quality issue, since it’s impossible to deliver a product before the order was created.
- Process. This could be due to a flaw in the online order creation tool, where the customer can select any unrestricted date, or where a placeholder is added if the field is empty.
- In the ‘Sales’ table, the ‘Sales’[Billing Date] is always the end of the month, even though the business want to see sales by workday in the month.
- Quality? This might seem like a data quality issue, because it implies the business make all their sales on the last day of the month.
- Process. The business does their invoicing on the last day of the month. They prefer to view sales by the ‘Sales’[Delivery Date], instead.
Data quality is a broad (and contentious) topic. In general, you should ensure that you’ve dealt with any detectible data quality issues before you proceed, otherwise you may make suboptimal transformations and produce a suboptimal model.
Step 7: Transform the data
If the issues do not pertain to data quality, you or someone else who maintains the upstream data source will need to transform the data so that it fits your needs. We discuss data transformation in detail in the next article of this series.
In conclusion
Once you’ve gathered the requirements for your semantic model, you should ensure that your data is model-ready. To do this, you explore the data with an appropriate tool and identify, document, and communicate issues that you find. Generally, your objective is to resolve data quality issues, and prepare to transform your data in the next step.
In the next article of this series, we’ll share how you can transform your data for a semantic model. One way to do this is by using Power Query in the semantic model itself, and we’ll explain how you can best view and edit Power Query from within Tabular Editor.

Pingback: Write DAX for a semantic model – Tabular Editor Blog
Pingback: Create semantic model relationships – Tabular Editor Blog
Pingback: Validate semantic model relationships – Tabular Editor Blog