Define the initial logic in your model by linking data across tables so that you can aggregate, filter, and slice your values.
In this series, we provide tips for how to effectively build a semantic model. In the previous article, we described how you connect to and transform data for use in a semantic model. At this point, you’ve got tables and columns in your model, and you’re ready to add the business logic.
In this article, we describe one of the first steps to add this logic by creating relationships between tables. Relationships are one of the most important objects in your model. However, they’re also deceptively simple; it’s straightforward to create relationships, but there are many different types and properties. It’s easy to create problems in your model when relationships and the columns between them aren’t set up correctly.
What is a relationship and why is it so important?
A relationship allows you to filter or group data from one table by columns in a second table. To do this, you match equivalent columns (referred to as key columns, or keys) from each table. Relationships are integral for you to shift from a set of disconnected data points to a functional model of a business process.
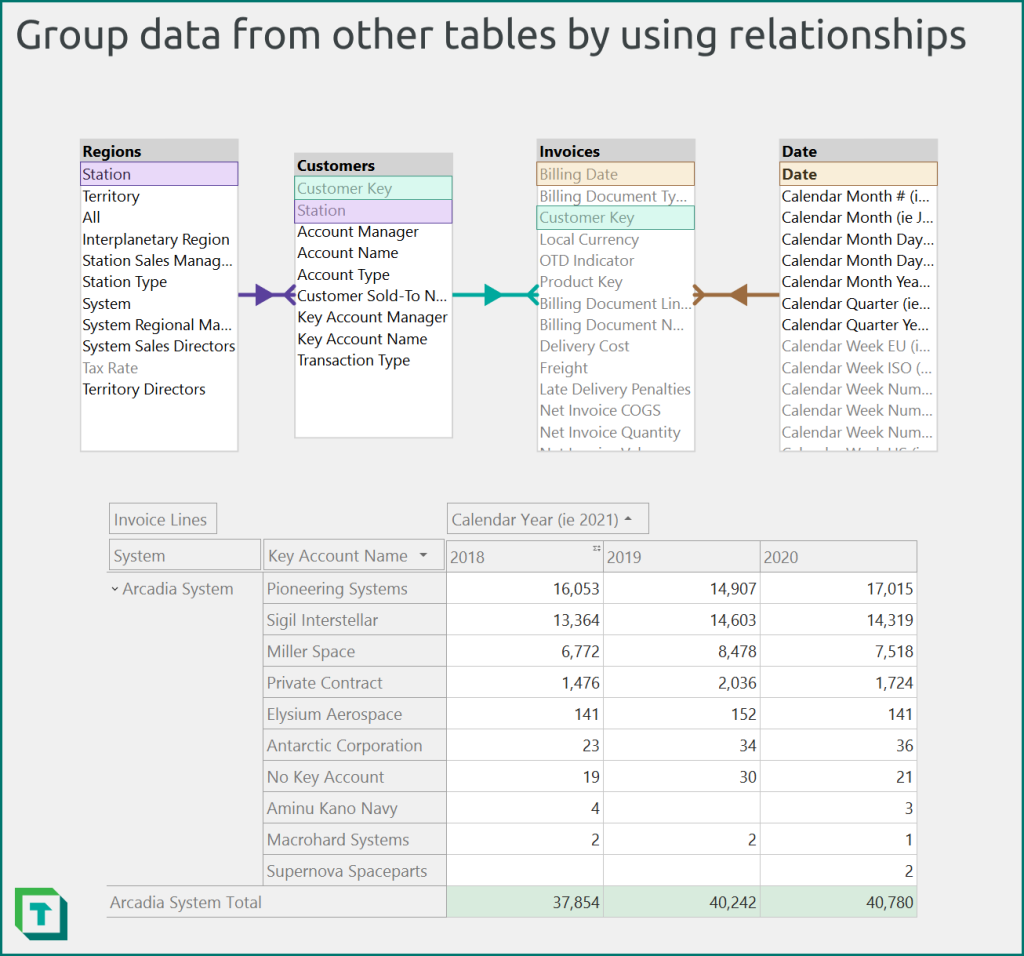
Figure 1: You group data in the ‘Invoices’ table for the ‘Customer’, ‘Region’, or ‘Date’ dimensions by using relationships. You use relationships instead of joining these four tables together, which results in a more organized and performant model. For example, you can create a matrix (or pivot grid in Tabular Editor) summarizing invoice lines (from ‘Invoices’) by ‘Regions’[System], ‘Customers’[Key Account Name], and the ‘Date’[Calendar Year] (e.g. 2021) columns.
There are different types of relationships that you can create in a model, but physical relationships are most common. These are the relationships represented by arrows between tables in your model view. You create a relationship between two columns, specifying the direction of the relationship and whether it’s active, or not. In a semantic model, physical relationships use in-memory data structures to enable efficient navigation across related tables. These in-memory data structures are conceptually similar to a SQL index, but differ in that they’re a result of how the VertiPaq compresses and stores data in memory.
In other blogs, videos, and articles, you’ll hear about different kinds of physical relationships. An overview of relationships by their cardinality (with examples) are depicted in the following diagram.
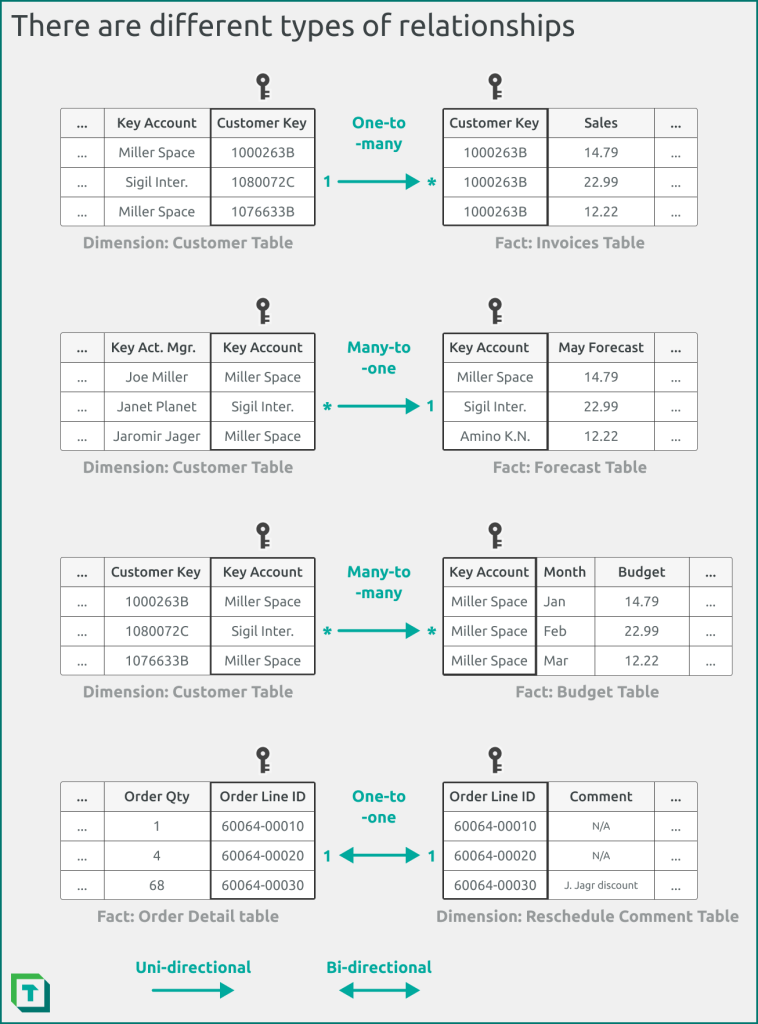
Figure 2: Relationships differ in their cardinality, such as one-to-many (or many-to-one), one-to-one, and many-to-many. They also differ in their directionality, with uni-directional and bi-directional relationships. One-to-one relationships must be bi-directional, but other relationship types can be either uni-directional or bi-directional. Note that this example depicts a limited uni-directional many-to-many relationship, instead of a bi-directional many-to-many relationship.
WARNING
Until recently, relationships in default Tabular models were case insensitive. That means that the casing in key columns had no effect upon the cardinality of the relationship. However, relationships in a Direct Lake model created in Fabric are case-sensitive because the semantic models have a case-sensitive collation. Normally, a semantic model in Power BI desktop has an empty collation property.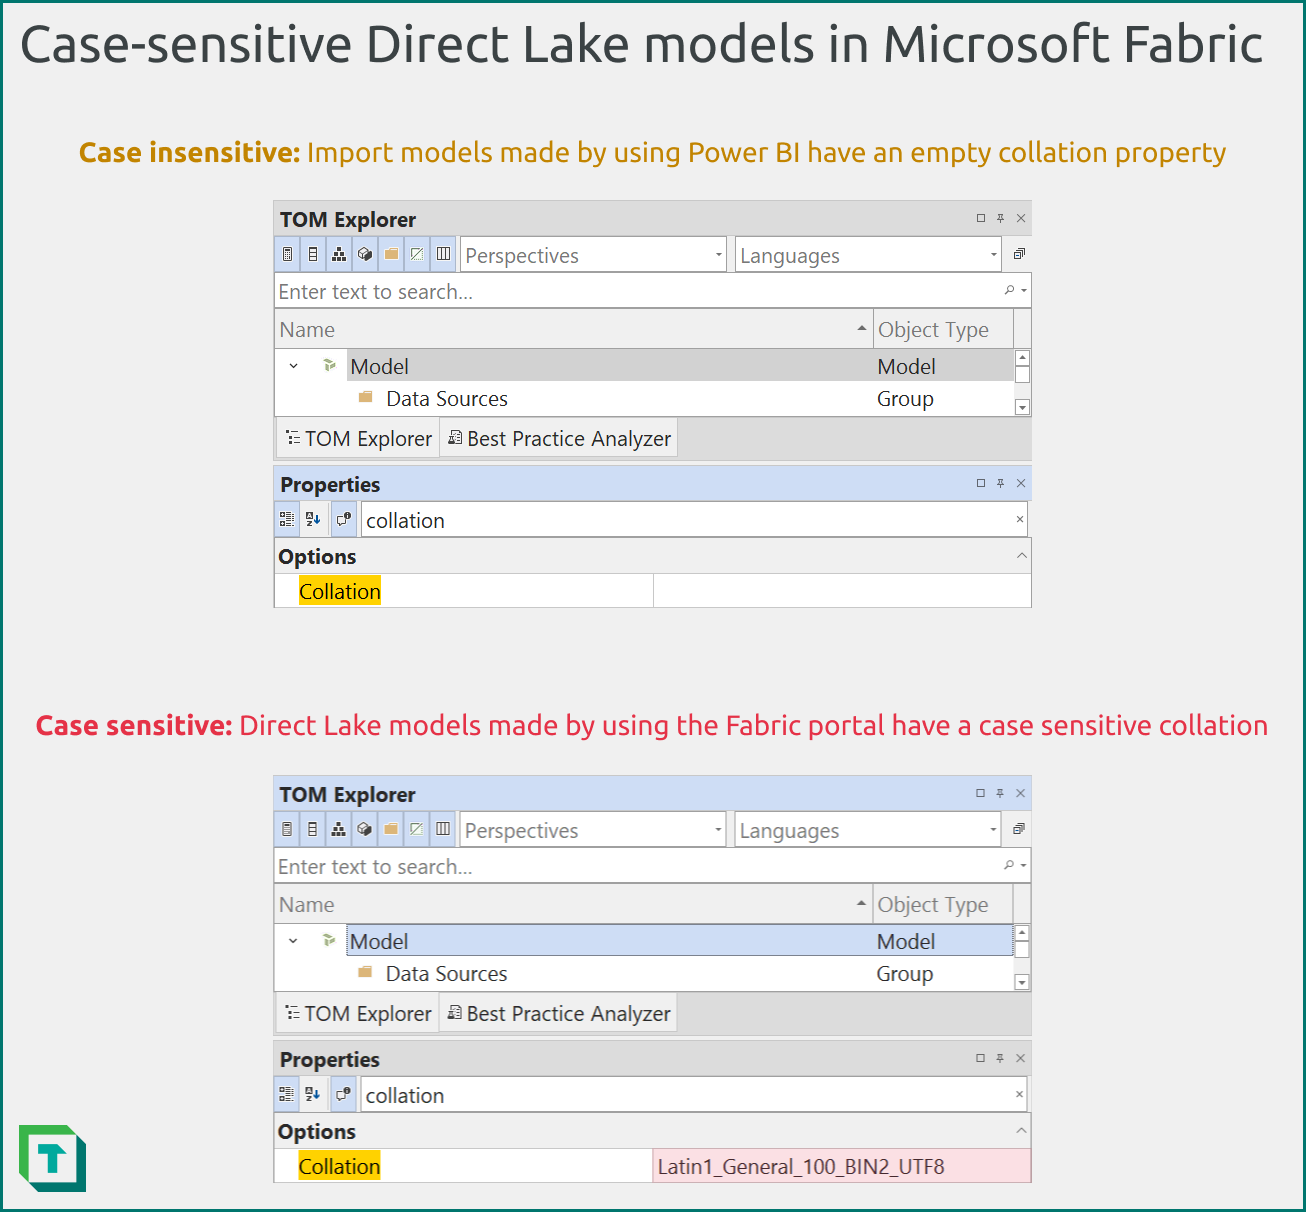
Figure 3: Direct Lake semantic models that you create in the Fabric Portal (i.e. in the Lakehouse experience) have a case sensitive collation property. This is a new behavior that differs from previous import and DirectQuery models created by using Power BI Desktop, which had an empty collation.
A case-sensitive collation means that values on one side of the relationship will expect values with the same casing as on the other side of the relationship. This has no impact if you use an integer surrogate keys in your relationship; there’s no collation for a 64-bit integer, of course.
Consider the following examples: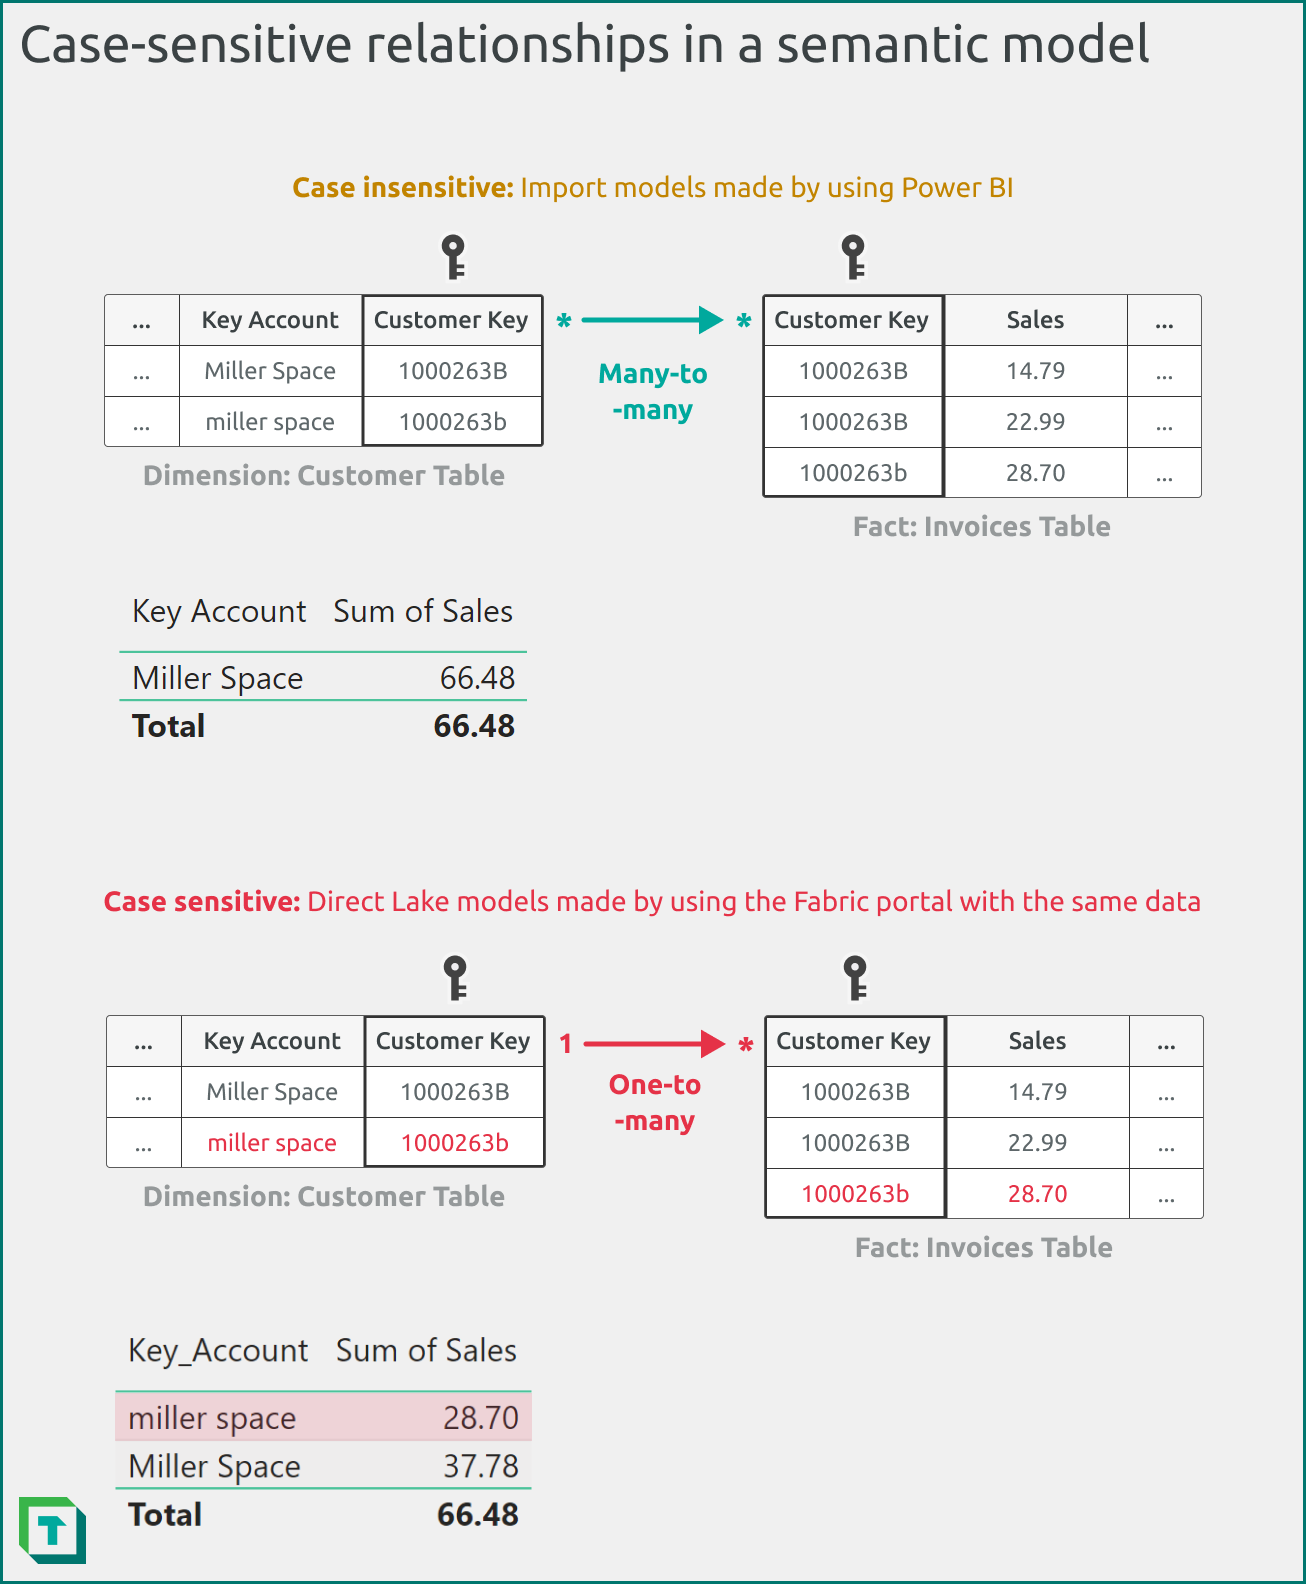
Figure 4: In a typical import or DirectQuery model created by using Power BI Desktop, casing doesn’t affect the cardinality that the model infers, nor DAX query results depicted in a Power BI visual. In contrast, a case sensitive model considers casing when determining relationship cardinality and returning query results. Keep this in mind when transforming your data and preparing it for use with a Direct Lake semantic model.
When you create a Direct Lake model by using web authoring in the Fabric portal, ensure that you anticipate the consequences of this case sensitivity. To create a case-insensitive Direct Lake model, you must first create it by using Tabular Editor, then deploy it to the Fabric Portal. Note however that the SQL endpoint of the Fabric data warehouse has a case sensitive collation, so DirectQuery fallback might produce different results than Direct Lake, in this scenario. To avoid this, you should set Direct Lake fallback to Direct Lake only.
You can’t change your model collation once it’s set.
Relationships form the basis of the logic in your semantic model, as you use them to link facts to dimensions. Your DAX measures, report visuals, and semantic model queries rely upon relationships to group and filter the data as you expect.
How to create relationships
You can create and manage relationships by using both Power BI Desktop and Tabular Editor. As mentioned in the introduction of this article, creating relationships is very easy; ensuring that you have the appropriate key columns and properties configured is what’s hard.
Create a relationship by using Power BI Desktop
You can create a relationship in Power BI Desktop by using the user interface in the model view window, as depicted in the following diagram. Note that by default, Power BI Desktop will autodetect relationships when you first load or refresh a local semantic model.
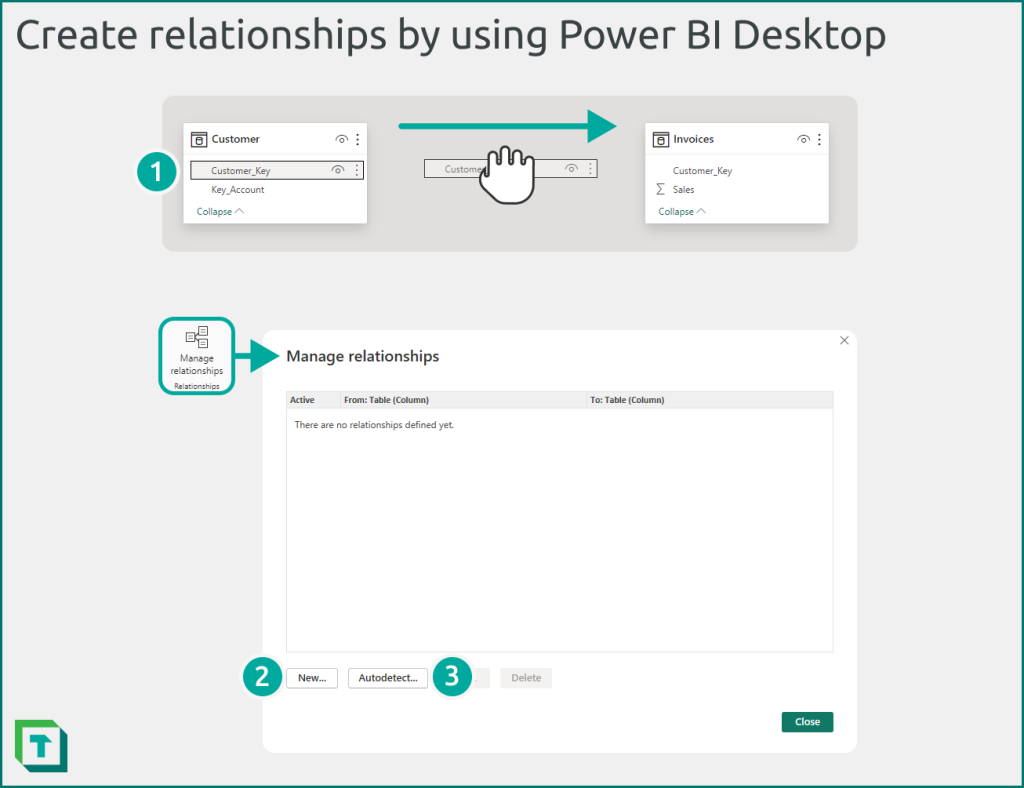
Figure 5: In Power BI Desktop, you can create relationships from the model view.
You can create a relationship in Power BI Desktop in three ways.
- Drag-and-drop in model view: Select the model view, find the tables, and drag the “from” key column to the “to” key column. You can double-click any relationship to edit its properties.
- Relationship editor: Select “manage relationships” from the top of the model view, and select “new…” to create a new relationship. You can also manage existing relationships.
- Automatically detect relationships: Power BI Desktop will by default automatically detect relationships between similarly named and typed columns. You can adjust this behaviour from the Power BI Desktop options. Disabling automatic relationship detection is generally recommended when you’re developing your semantic model by using Power BI Desktop, because it can result in unexpected relationships when you add new columns or modify the name and data types of existing columns.
TIP
Power BI Desktop will automatically inactivate bi-directional relationships that create ambiguity. When you try to activate these relationships, it will give you a warning about these ambiguous paths. You should avoid creating ambiguous models, as it produces unexpected query results.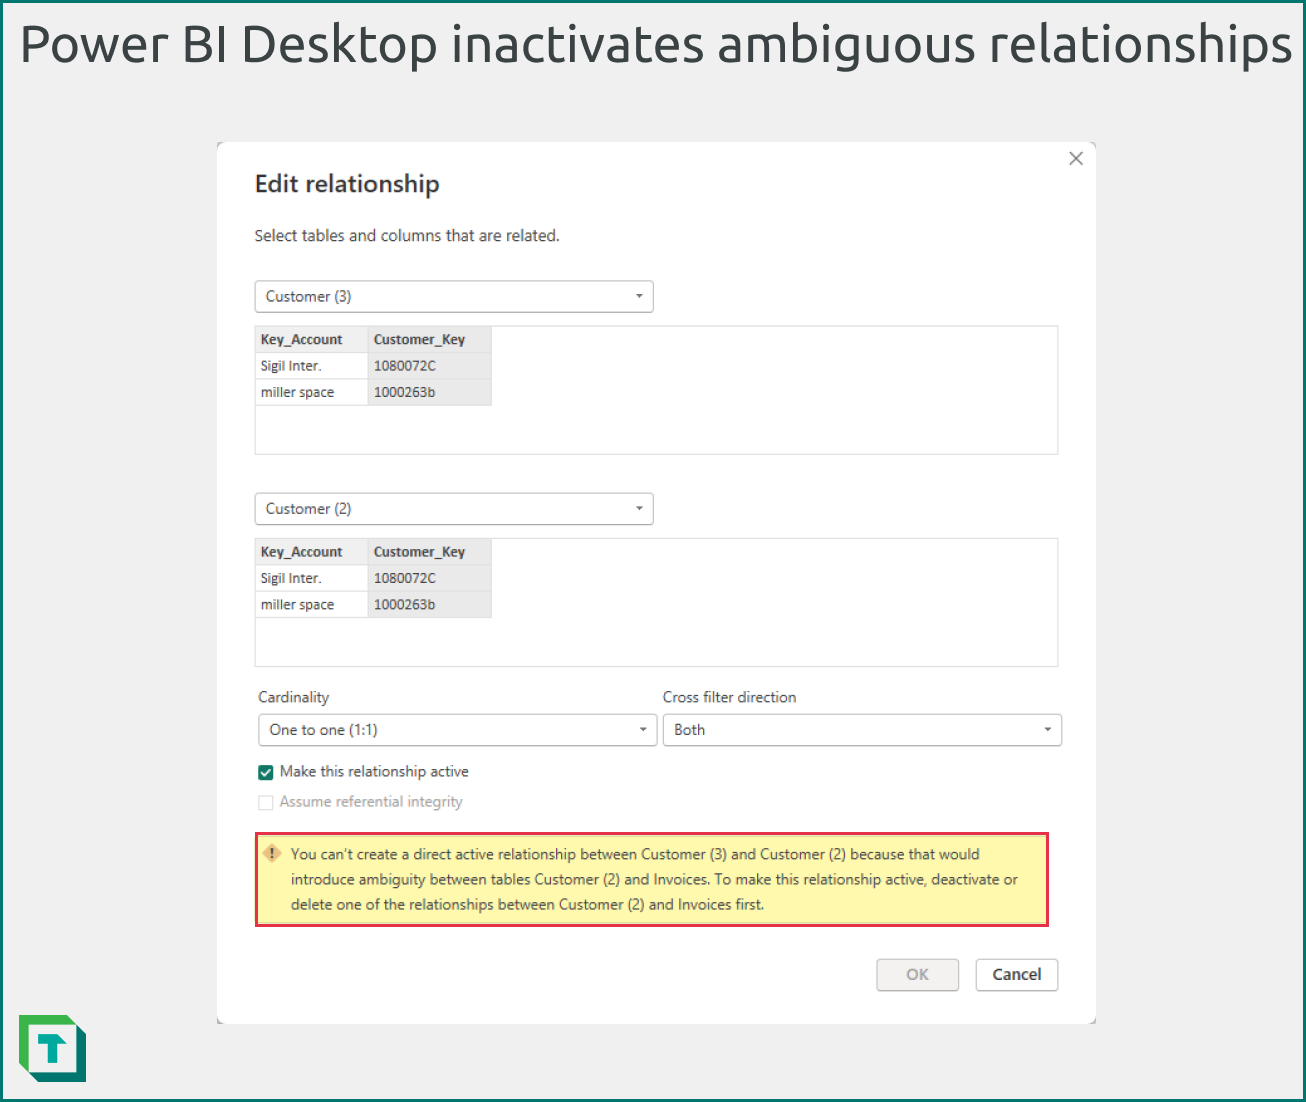
Figure 6: Power BI Desktop will give you a warning if you try to activate an inactive relationship that would result in ambiguity.
Create a relationship by using Tabular Editor 3
You can create relationships by using the user interface or C# script dialogue in Tabular Editor, as depicted in the following diagram.
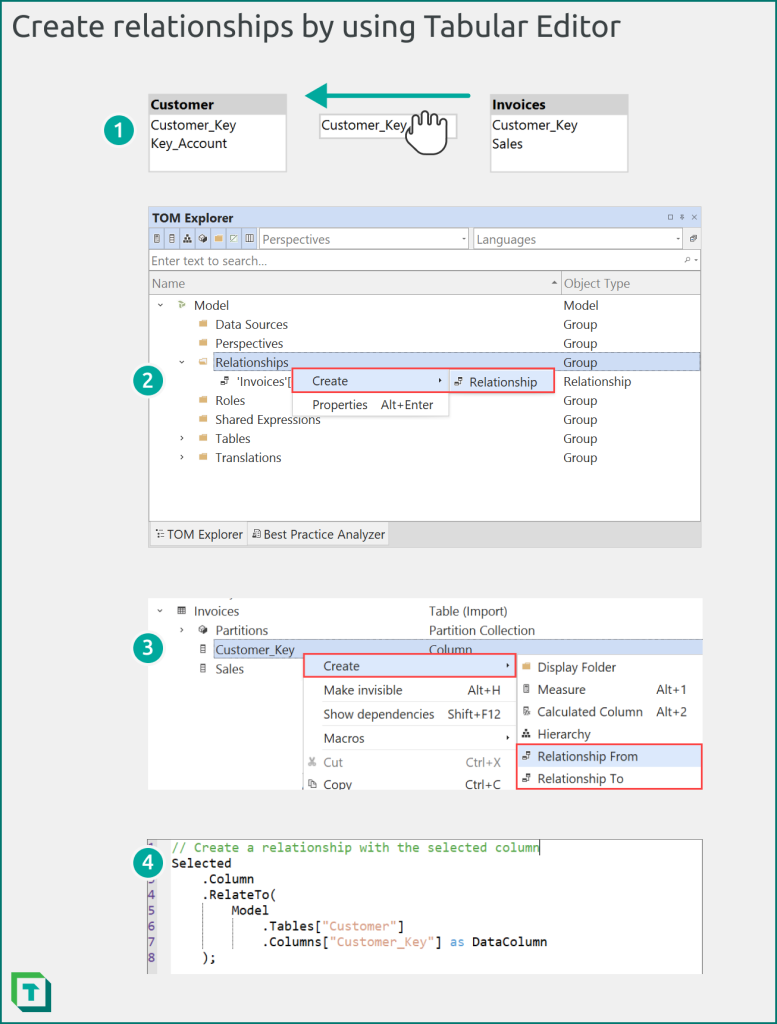
Figure 7: In Tabular Editor, you can create relationships from the model diagram view, the TOM explorer, or a C# script.
In Tabular Editor, you can create relationships in four different ways.
- Model diagram: Create a new model diagram, add the tables, and then drag the “to” key column to the “from” key column. Note that this is the opposite direction as Power BI Desktop. You can right-click any relationship to edit its properties.
- TOM Explorer (relationships group): Right-click the “relationships” group and select create > relationship. You can also select any existing relationship to modify its properties from the Properties window.
- TOM Explorer (key column): Right-click a key column and select Create > Relationship From or Relationship To. When you select a table in the following relationship dialogue, Tabular Editor will automatically suggest a key column for a plausible valid relationship.
- C# Script: You can programmatically create and modify relationships by using C# scripts. For instance, you can use a C# script to automatically create relationships between similarly named or typed columns, or based on other metadata that you specify. You can tailor this to use additional metadata or even DAX query results, and save the script as a macro that you can run whenever you create a new model.
TIP
Tabular Editor 3 will warn you when you try to create a relationship where there are RI violations or other potential issues with your relationships. You find these warnings either in the Create New Relationship dialogue or the Messages window.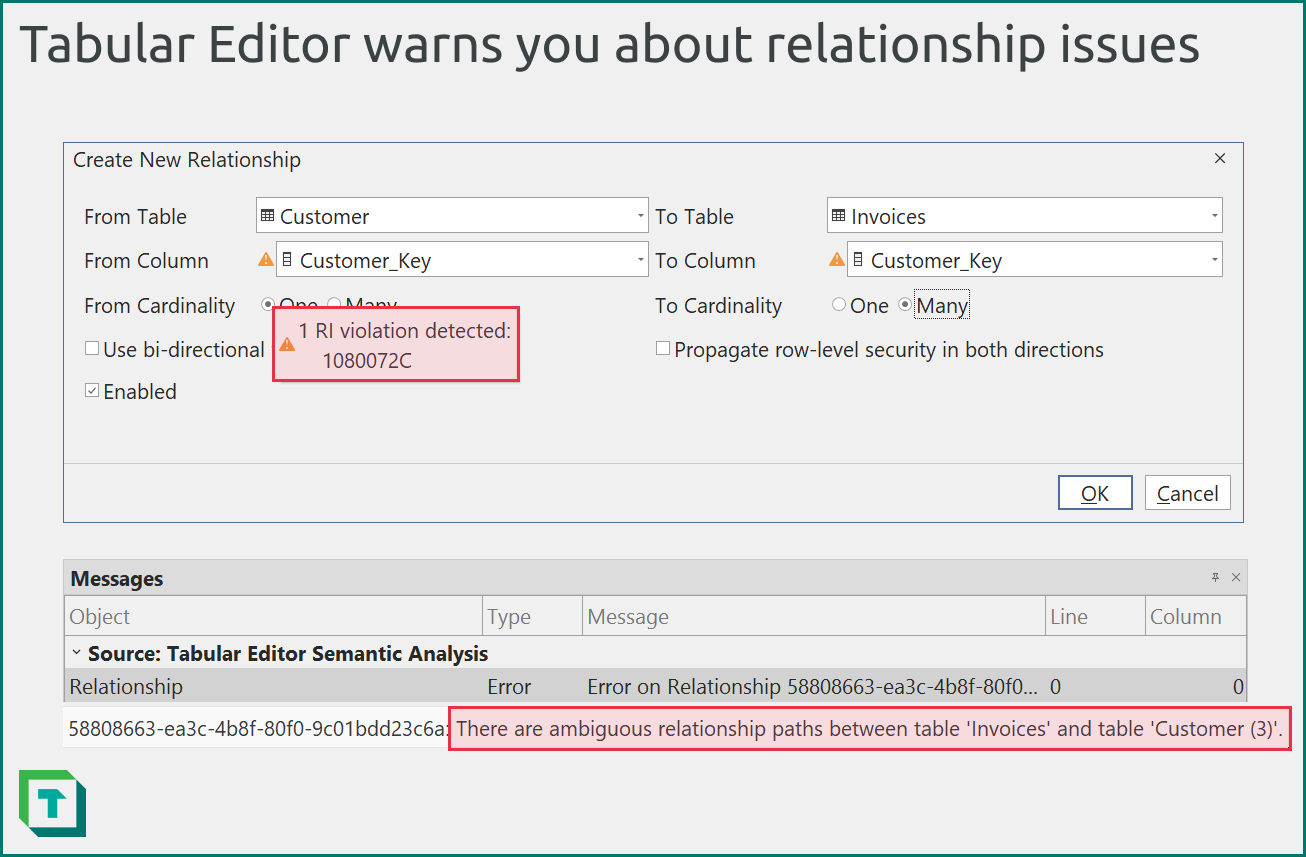
Figure 8: Tabular Editor warns you when you will introduce issues in your model with a new relationship. For instance, if the relationship will have RI violations, or you’ll introduce ambiguity.
Relationships are more complicated than you think
Relationships are deceptively simple; there’s more to it than drag-and-drop. Depending upon the participating key columns and the relationship properties you configure, you might obtain different query results, performance, and functionality.
When you create a relationship, you should check the following:
- Is the cardinality what you expect? Most relationships should be one-to-many from the dimension to the fact table. If you intend to use a different cardinality, such as many-to-many or one-to-one, ensure that you are aware of the consequences for your model performance and query results.
- Is the directionality what you expect? Most relationships should be uni-directional from the dimension to the fact table. If you intend to use bi-directional relationships—which you should generally avoid—ensure that you avoid ambiguity and are aware of the consequences for model performance and query results.
- Is the relationship active? Most physical relationships should be active, unless you are using role-playing dimensions and activating the relationship by using the USERELATIONSHIP DAX function inside of CALCULATE.
- Are you missing keys? Relationships should ensure referential integrity to be valid, meaning that all of the values in the fact table (on the “to” or “many” side of a one-to-many relationship) have a corresponding value in the dimension table (on the “from” or “one” side of a one-to-many relationship). If you’re missing keys, you end up with values mapping to (Blank) or empty rows.
There’s many advanced concepts about relationships that might be useful for you to know, depending upon the model that you intend to build and the requirements that you should address.
- Relationships between columns of Date datatype: A relationship between Date columns are treated as DateTime datatype., even when formatted as Date, Time, or Date/Time/Timezone. There’s special considerations when you must choose between using columns of date and integer data types.
- You encounter this when you create a Date dimension table and decide how it will relate to your fact tables.
- Relationships between integer columns and performance: A relationship between integer columns is commonly assumed to be more performant than relationships between columns of other data types. Unlike in a relational database, this isn’t always the case.
- You encounter this typically when you design your model and transform the data.
- Virtual relationships: A type of relationship that you define in DAX measures or calculated columns. To do this, you use functions like TREATAS, which can transfer the filter context from one table to another. Unlike physical relationships, a virtual relationship doesn’t take advantage of relationship indices, and are thus less performant.
- You use virtual relationships for many different kinds of advanced functionalities and features. For instance, if you want selective measure replacement, or you want to sync report slicers.
- Invalid relationships and the (Blank) row: A concept where your model adds a (Blank) row if there’s a referential integrity violation with the relationship. Referential integrity violations are when there are orphaned rows in the N-side table, because the key has values for which there’s no corresponding value on the other side of the relationship. You can identify RI violations when you validate relationships (discussed in the next article of this series). For instance, you can use the VertiPaq Analyzer in Tabular Editor 3 to identify RI violations and view sample missing values.
- You often deal with this whenever you have keys in a fact table that are missing from your dimension table. For instance, new customers who are in the ‘Budget’ table, but for whom you don’t yet have a customer master data record. This is a common challenge.
- Inactive relationships: A type of relationship that isn’t used unless it’s activated by the USERELATIONSHIP function in DAX. You use inactive relationships with role-playing dimensions. Inactive relationships count when determining referential integrity violations and whether the VertiPaq engine should add a (Blank) row to the table.
- You might need this when a dimension, like Date, should have a relationship with multiple columns in a fact, like [Order Date], [Billing Date], and [Goods Issue Date]. For instance, you might want to let users choose which date to use to summarize the data.
- Bi-directional relationships and ambiguity in DAX: A scenario where multiple bi-directional relationships can create alternate paths to propagate filters. This can produce unexpected results when you summarize data.
- You might encounter this when you decide to use bi-directional relationships in a model. This typically happens if you use bi-directional relationships to sync slicers (don’t; there are better approaches).
- Bi-directional relationships and row-level security (RLS): A scenario where you use bi-directional relationships and opt for the security filter to also propagate in both directions.
- You might encounter this when you have configured RLS in your semantic model for a table that’s in a relationship chain where one or more relationships use bi-directional crossfiltering.
- Expanded tables in DAX: A concept in DAX where the ‘base’ table in a many-to-one or one-to-one relationship includes all columns of related tables. You use expanded tables to access related columns of a referenced table for some DAX expressions.
- You encounter this when you want to perform more advanced DAX calculations. For instance, if you want dynamic currency conversion.
- Limited relationships: A concept where the referential integrity can’t be guaranteed; there’s no guaranteed “one” side of a one-to-many relationship. Limited relationships don’t use expanded tables.
- You encounter this when you use many-to-many relationships, or relationships in some composite models (known as cross source group relationships).
- Assume referential integrity: A relationship property that you can enable in Power BI Desktop or Tabular Editor (called Rely on Referential Integrity) when you have a semantic model in DirectQuery storage mode. Assuming referential integrity results in the tables using an inner join instead of an outer join, which can improve performance. This performance improvement depends upon the query planner and indices in the source database used in the DirectQuery model.
- You encounter this when you build and optimize DirectQuery models or Direct Lake models that have DirectQuery fallback enabled.
In conclusion
Relationships are one of the most important objects in your model, and the first objects that you create once you’ve set up tables and columns. It’s simple to create relationships, but there are many additional properties and scenarios to consider so that your relationships behave as you expect. In the next article of this series, we’ll show you how you can validate your relationships in a semantic model by using Power BI Desktop, Microsoft Fabric, and Tabular Editor.