Starting your model by getting the right data in the right shape
A semantic model provides meaning to data by using objects, calculations, and logic to represent a real-world process, like sales or pricing. A semantic model is a core component of Microsoft Fabric and Power BI; it’s one of the most important item types you manage in an end-to-end solution, as it’s the primary way in which your end-users interact with the data. It’s therefore important for you to know how to effectively design, build, and deploy good semantic models efficiently so that you can meet business data needs.
In this series, we provide some tips and guidance to help you effectively build a semantic model. In the previous article, we describe how you evaluate your data before starting to build your model, to identify and resolve possible issues. This step is also important to understand what transformations you need to make to get your data in the right shape to make a good model.
In this article, we show you how you can connect and transform data when you build your model by using Tabular Editor or Power BI Desktop.
Choose how you’ll transform your data
To transform your data for a semantic model, you have many options in Fabric and Power BI. Depending upon your needs, available resources, skills, and preferred workflow, you can choose a different tool; there’s no “best” approach. Generally, it’s considered a good practice to shift these transformations as far upstream as possible, and as far downstream as necessary (a paradigm often quoted as “Roche’s maxim”). The reason for this is that downstream transformations tend to be more difficult to maintain and can have performance consequences.
When transforming your data, your objective is to create a data structure that best fits the intended purpose of the model. Typically, this involves creating a star schema with distinct fact and dimension tables, but the precise structure of your model varies depending on your requirements, and what you’re trying to achieve.
Approaches to transform data by using Fabric and Power BI
You have different tools available to transform data in both Fabric and Power BI. Some common examples of these tools are depicted in the following diagram.
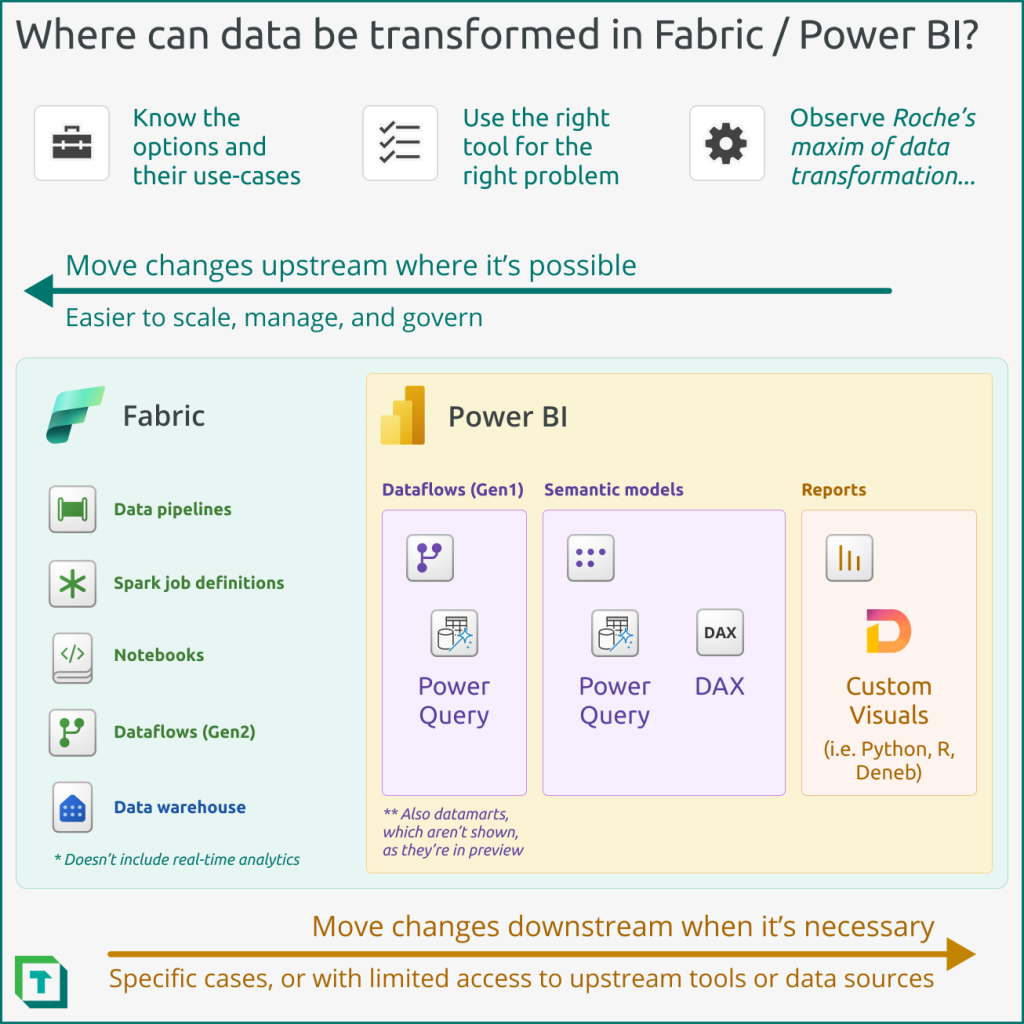
The following are examples of ways you might transform your data by using the different items available in Fabric. Typically, these tools ingest data from a source, transform it, and land it where your semantic model can access the transformed data. You may use one or more these different tools to transform your data.
- Dataflow Gen2 (Power Query)
The following are examples of ways you might transform your data by using Power BI:
- Power BI dataflows (Gen1 dataflows; Power Query)
- Power BI Datamarts (in preview; Power Query)
- Semantic model (Power Query or DAX)
- Reports (Custom visuals like Python, R, or Deneb, where minor transformations fit the data to the specific, custom visual)
Generally, you want to try to leverage the appropriate tools to do the “heavy lifting” transformations before the data reaches the semantic model. This is essential when you intend to build a semantic model that uses Direct Lake (only in Fabric) or DirectQuery storage mode. However, when you’ll build an import model, it’s common that you may need to do some mild to moderate transformations in Power Query, still. Examples of such transformations include:
- Reducing detail either by limiting rows, columns, or decimal precision (all of which are essential steps to reduce the size and increasing the performance of your import model).
- Adding tables necessary for reporting, like measure tables, date tables, or selection tables.
- Adding columns necessary for reporting, such as for sorting, binning, or grouping data in certain ways.
In the rest of this article, we’ll show you how you can connect to and transform data in Power Query using Tabular Editor, Power BI Desktop, or a combination of both.
Connect to and transform data in your semantic model
Performing transformations in Power Query for semantic model can be a perfectly valid approach, depending upon your model and data. Before you start transforming the data, be warned that performing many transformations in the semantic model can be problematic. For instance, this approach doesn’t scale as well for larger data volumes and complex transformations, compared to other, upstream tools.
To connect to and transform your data in Power Query while building your model in Tabular Editor, you can take one of three different approaches.
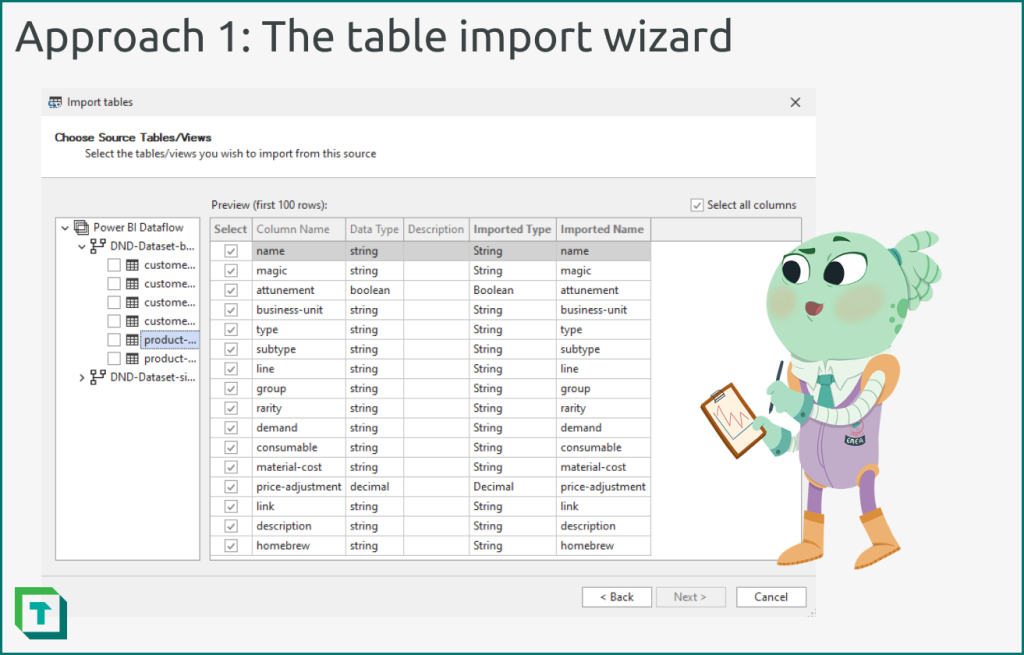
Approach 1: Connect to a supported source with the table import wizard
For supported sources like a SQL Endpoint or dataflow, the table import wizard in Tabular Editor will create the objects and generate the Power Query code for you. Use this approach when:
- You are connecting to a supported source.
- You don’t need to use the Power Query user interface (UI).
- You don’t need to view the data as you’re transforming it with Power Query / M.
To use this approach, follow the below steps:
- From the ‘Model’ menu, select “Import tables”.
- Select “Use implicit data source (credentials managed by the Fabric/Power BI Service).
- Select your data source from the list.
- Enter the appropriate connection information and authenticate to connect to your data source.
- Choose the source tables/views that you want to import metadata from. While selecting a table or view, you can select specific columns and even preview the data.
- Proceed through the wizard and confirm; Tabular Editor will automatically add the objects to the model.
- Select the table partition to view (and adjust) the Power Query (M code).
With this approach, you can push transformations back to an upstream tool and connect to the transformed data in one of the supported sources (like Fabric OneLake). If you’re one of the rare people skilled in writing M code, you can further adjust the partition expression right in Tabular Editor.
However, what if you are connecting to aa source that’s not supported by this table import wizard, like SharePoint? Or, what if you want to do further transformations, and need the Power Query UI?
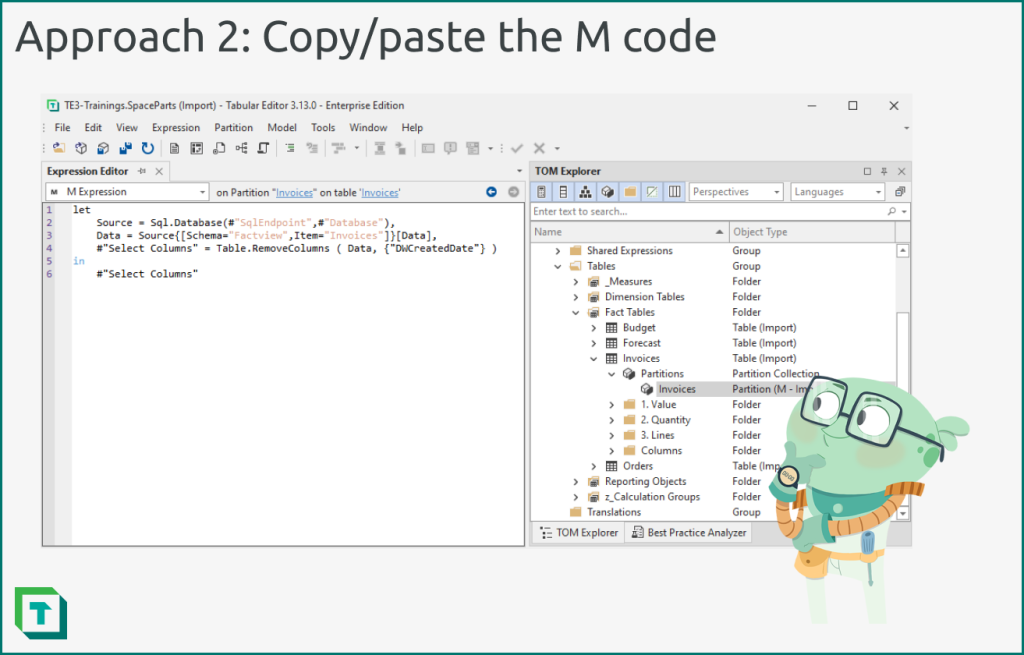
Approach 2: Use Power Query and copy the advanced editor code to Tabular Editor
You can connect to your data source using the Power Query user interface of Power BI Desktop, Excel, or dataflows, then copy the M code to Tabular Editor when you’re ready. With this approach, you benefit from using the Power Query UI and seeing the data as you transform it; however, it’s a manual step to switch tools.
Use this approach when:
- You’re connecting to an unsupported source.
- You’re comfortable with the Power Query experience.
- You have a reason to prefer working on model metadata in “disconnected mode”, instead of maintaining a constant connection or importing the data like you would in Power BI Desktop.
To use this approach, follow the below steps:
- Connect to your data source from your client tool of choice, as you normally would.
- Transform your data using Power Query, as you normally would.
- When ready, open the “advanced editor” and copy your code.
- In Tabular Editor, create a new table.
- Select the table partition and paste the M code that you copied.
- Save your changes, then right-click the table, and select “update table schema”. Tabular Editor will automatically create the columns and set their data types based on your code.
Approach 3: Use Tabular Editor as an external tool for Power BI Desktop
You can also continue to develop the model from Power BI Desktop, saving and deploying the Power BI projects (.pbip) file. In this scenario, you benefit from the productivity enhancements of Tabular Editor, while having the convenience of the user interface of Power BI for managing queries and other features.
Use this approach when:
- You are most comfortable using Power BI Desktop to develop and publish semantic models.
- You are using a Tabular Editor 3 Desktop Edition license.
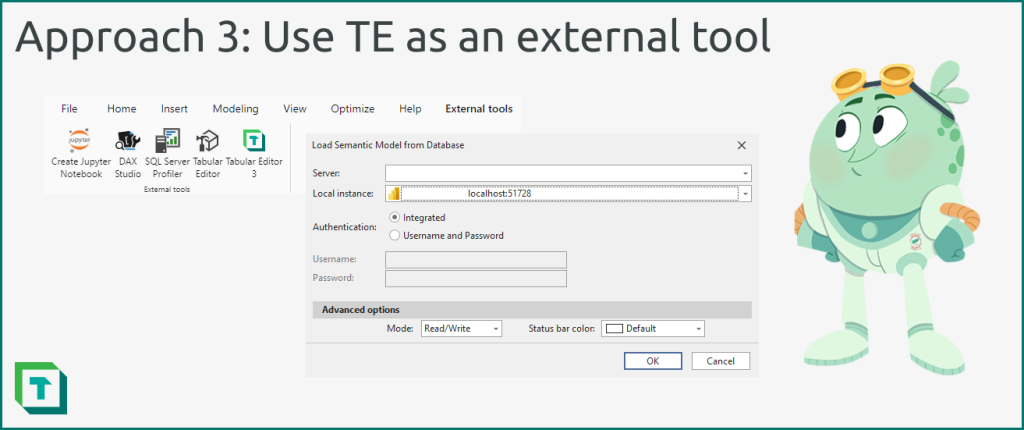
To use this approach, follow the below steps:
- Connect to and transform your data source from Power BI Desktop, as you normally would.
- Once you connect to your data, proceed with development using a combination of Power BI Desktop and Tabular Editor, as you see fit. You can open Tabular Editor 2 or 3 from the ‘External Tools’ ribbon.
Add static or calculated tables, if necessary
Many semantic models contain additional tables aside from those you add from the data source. These tables typically serve a specific function within the model or for a connected report. Examples of these tables include:
- Measure tables: Tables where you sort and organize measures away from other objects.
- Date table: A table made in Power Query or DAX for time intelligence (if a sufficient table isn’t available from the data source).
- Last refresh: For import storage mode models, a table with a scalar value containing the date and time of the last successful model refresh.
- Static tables: Tables used for various purposes, typically to achieve specific reporting functionalities like dynamic measure selection.
Often, you need to add the same static tables when you create a new model. This is therefore a good process to automate by using a C# script in Tabular Editor. For instance, this script creates a measure table, and this script creates a date table.
Once you’ve finished and have all the tables in your model, you can proceed with creating relationships, authoring DAX, and adding additional business logic.
In conclusion
Once you’ve gathered the requirements for your semantic model, the next step is to connect to your data. You want to ensure your data is model-ready before you proceed to this step, and if not, ensure that you deal with data quality issues and transform it with an appropriate tool of your choice. If you need to transform data in Power Query, you can take various approaches to doing this while you develop your model in Tabular Editor, Power BI Desktop, or a combination of the two.
In the next article of this series, we’ll share how you can create, test, and manage relationships in your semantic model with Tabular Editor and Power BI Desktop.

Pingback: Validate semantic model relationships – Tabular Editor Blog
Hello,
Is there any way to find number of tables/ calculated column/ measure/ relationships built from the semantic model using Tabular editor?
Thanks
Hareesh Devarakonda
Hi Hareesh
You could give this script a try: https://docs.tabulareditor.com/common/CSharpScripts/Beginner/script-count-things.html
It counts the different model objects that exists in a semantic model
Hi, regarding option 2, could you please eloborate in which way implicit data sources are “managed by the Fabric/Power BI Service”? When I use them, I have to define a server address and I’m wondering how this address could be changed automatically when I deploy the model to production.
Thanks, Michael
Hi Michael
Implicit data sources’ credentials are managed by the Fabric/Power BI service, i.e. you have to authenticate your credentials in the service through the semantic model’s settings -> Data Source Credentials.
Ideally, you should use shared expressions so that your table partition M is parameterized and you can then change those shared expression upon deployment. This can be done either through your Azure Devops CI/CD pipeline or Power BI’s deployment pipeline. See for example: https://learn.microsoft.com/en-us/fabric/cicd/deployment-pipelines/create-rules
I hope this helps
ok, thank you very much, Morten