Discussing semantic models in Fabric using plain language
Semantic models (formerly datasets) in Microsoft Fabric are essential for you to get value from your data, both in large enterprise scenarios and smaller, self-service analytics. Semantic models provide a powerful, performant, and secure way to use data to answer business questions from different client tools. But what exactly is meant by the term semantic model? How is a semantic model different from other Fabric items? Furthermore, how can you make a good semantic model, effectively?
In this article, we break through the technical jargon to understand what a semantic model is, why it’s important, and how it’s made.
In subsequent articles of this series, we examine each step along the path to build a semantic model, explaining key considerations for each step. We’ll also describe how you can best achieve success in creating a semantic model by using Power BI Desktop and/or Tabular Editor 3.
Semantic models in a nutshell
A semantic model isn’t a new concept. In fact, it’s something that’s been in the data world since 1976 (J.H. ter Bekke) and 1977 (Hammer & McLeod), nearly half a century ago. This concept hasn’t been hiding in the proverbial data bushes the last 50 years, either. Since then, the term has arisen in various applications, products, and theory. The semantic model isn’t new to Microsoft BI, either. It already existed within SQL Server Analysis Services in 2012 (with the BISM).
Chances are, most BI professionals have heard the terms semantic model or semantic layer, before. However, for many people, this is a new and quite confusing technical term. This is true particularly for the many Power BI users who come from backgrounds outside of BI and computer sciences (and it’s reasonable to hypothesize that these users represent the vast majority of people who use Power BI).
So what is a semantic model, really?
Since semantic model is a technical term, it makes sense to break it down and understand why we use that term at all.
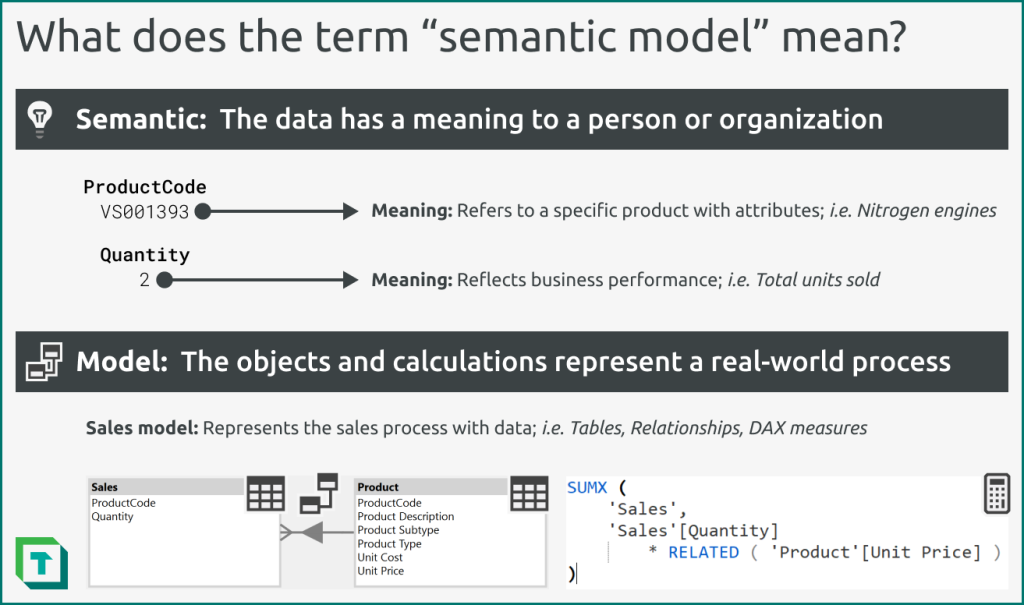
The term semantic model consists of two parts we should understand:
- Semantic: Semantics is a concept that refers to what things mean. For example, in linguistics, semantics refers to the meaning of words and phrases. In the data world, semantics refers to the meaning of data and its structures.
To give a specific example, a data entry from a sales transaction contains various attributes, such as Product Code or Quantity. The semantics of this information is the real-world business meaning it represents:- Product code: The product purchased. This code represents a particular product, including all its particular attributes, including descriptive attributes (like colour) and quantitative attributes (like price).
- Quantity: How much of the product was purchased. This number reflects the business performance, particularly if combined with other information, like price, currency, and cost.
- Model: We gather related data to answer questions and address problems about real-world processes or systems. As such, we are creating conceptual models of these processes and systems with the data. We create models by designing and building data structures like tables or columns.
For example, we collect information about transactions, customers, and products to answer questions or address problems about our sales. The resulting collection of data is a model. We may create a sales model by:- Defining then relating key attributes to values: Creating structured tables of descriptive attributes like ‘Customer’ or ‘Product’ (dimensions), and relating them to values (facts) through specific key fields, like a customer code or product code.
- Aggregating and comparing values: Defining a re-usable calculation logic (like measures in Power BI), which ultimately describes data queries to retrieve specific information.
To summarize, in a semantic model, we understand each “piece” of data in the context of its business meaning. For instance, each row can represent a sales transaction, to which we can map additional attributes (i.e. products) or calculations (i.e. total gross sales).
When we create a semantic model, we take data and translate meaning with the tables we define, the relationships we make, and the DAX measures we author.
What makes a dataset a semantic model?
Even before they were re-named, Power BI datasets were semantic models. They’re semantic models because a user can:
- Integrate and load data from different sources into a single database.
- Create, classify, and relate objects (like tables, columns, and measures) that represent real-world concepts.
- Specify business logic and aggregate data by using calculations (in DAX) to query the data model.
- Connect to the published (or deployed) model to use objects and aggregate data from different client tools, like Power BI Desktop or Excel.
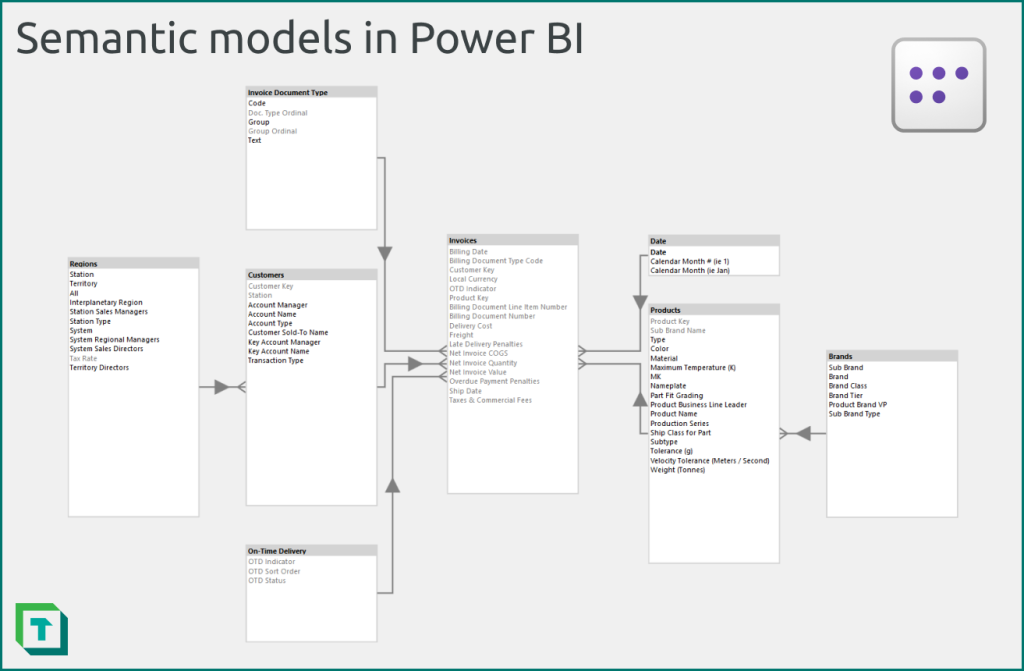
This is also illustrated in the model diagram in Power BI and Tabular Editor 3. The diagram is an abstraction that represents the real-world meaning in the model. An abstraction simply means that it doesn’t show the data, but a collection of named attributes (like columns) that’re organized (into tables) and with visual relationships.
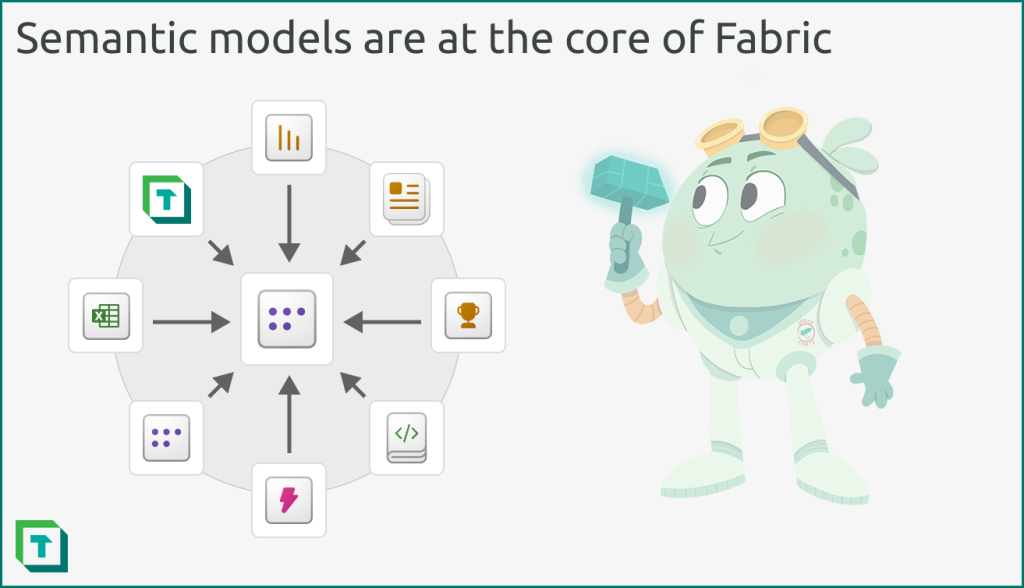
Power BI semantic models have always played a fundamental role in a Power BI solution. In Fabric, however, they become even more important.
What’s a semantic model used for?
Traditionally, a semantic model represents the last stop for data along its journey once it’s extracted, transformed and loaded into a database. Typically, the semantic model serves business users either through centralized reports or client tools that query the model. In Fabric, the semantic model is both the engine and GPS of the car driven by business users. They use this car when they’re seeking some data destination; when they try to answer business questions or solve business problems.
Since the semantic model usually faces the business directly, it plays a critical role in how organizations get value from their data. This is particularly true with Fabric. In Fabric, semantic models are used by different workloads catering to many unique personas, each of whom have their own questions or use-cases to address.
- Report consumers: People who consume–but don’t create–central reports.
- Business analysts: People who query semantic models from Power BI, Excel, or other tools to answer their own questions.
- Data scientists: People who use the business logic and context the semantic model provides to validate or inform their work (i.e. machine learning models and experiments).
- Others: There are many additional cases difficult to segment to a single persona, particularly since Fabric only recently went GA. For instance, we can also consider people who focus on optimizing time-to-action with alerting and automation tools provided by Data Activator.
Given the integral role of a semantic model in Fabric, it’s essential that your models are well-designed, implemented, adopted, and governed.
What defines a good semantic model?
When creating a data solution that relies on a semantic model, you want to ensure that the model fulfils some key criteria. Specifically, a quality semantic model should be:
- Complete: Consists of sufficient attributes and calculations to answer the relevant business questions in scope.
- Accurate: Calculations and logic in the model accurately reflect the real-world processes and systems that it’s intended to represent.
- Performant: Both data refresh (for import models) and DAX queries (in report visuals or connected client tools) are fast.
- Organized: Ensuring the model is consistent and easy to use from the different client tools who connect to it.
- Secure: Has the appropriate data security (like row-level security) to prevent access of data by unauthorized individuals.
- Scalable: Is designed and implemented to handle increasing data volumes, complexity, and user queries over its defined lifespan.
- Flexible: Can easily (and quickly) be adapted to changing business needs, where appropriate.
To ensure a quality semantic model, you typically follow a set of standard, iterative steps.
The steps to make a semantic model
When creating your semantic model, you typically follow a consistent series of steps. These steps mark the birth of the semantic model, before it enters the content lifecycle.
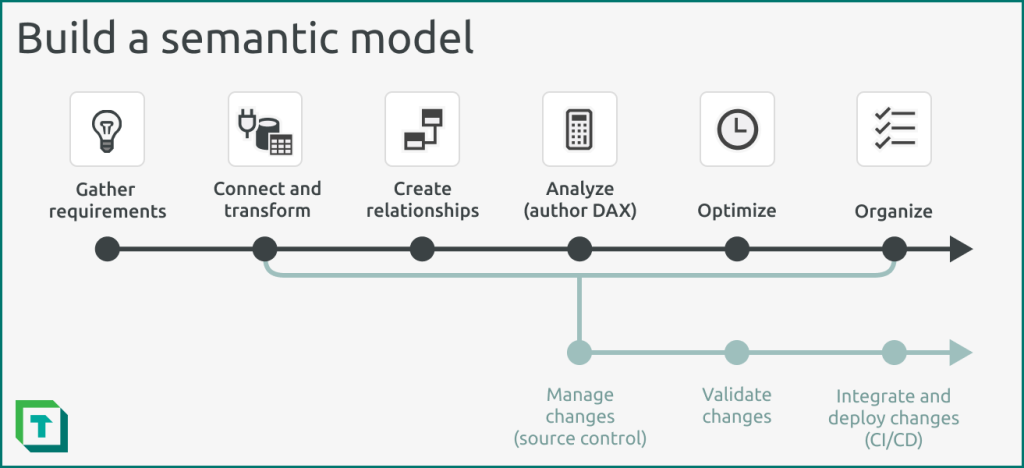
In the following articles of this series, we go through the steps to make your model, providing tips applicable to both enterprise and self-service models. In these articles, we’ll also explain how you can best use both Power BI Desktop and Tabular Editor in this step of the model development process, including C# scripts in Tabular Editor that can streamline or automate aspects of your development.
In conclusion
A semantic model provides meaning and context for data. We provide this meaning and context when we define model objects, their relationships, and calculations. In Fabric, semantic models are integral elements of your data and BI solutions. It’s important that you create quality semantic models.

Pingback: Connect to and transform data for a semantic model – Tabular Editor Blog
Pingback: Prepare your data for a semantic model – Tabular Editor Blog
Pingback: Gather Requirements for Semantic Models – Tabular Editor Blog
Pingback: Thoughts on Power BI datasets being renamed to semantic models