Write calculations in the DAX language to group and analyze your data.

In this series, we provide tips for how to effectively build a semantic model (formerly a dataset) in Power BI or Analysis Services. In the previous article, we described basics about DAX, and why it’s important when you make a semantic model. Once you’ve created and validated your relationships, you should now have the foundation of your model ready so that you can proceed with the next step.
In this article, we describe how you write DAX in a semantic model by using Power BI Desktop, Tabular Editor or Microsoft Fabric. The purpose of this article is to provide some tips about how you can write better DAX in each of these tools. In the next article, we’ll provide tips to specifically improve your productivity.
Ten tips to write better DAX
When you start to write DAX, you can benefit your future self and other developers with whom you collaborate if you follow some good practices. Following these practices ensures that you spend less time on understanding and maintaining code, and more time on productive, value-based tasks.
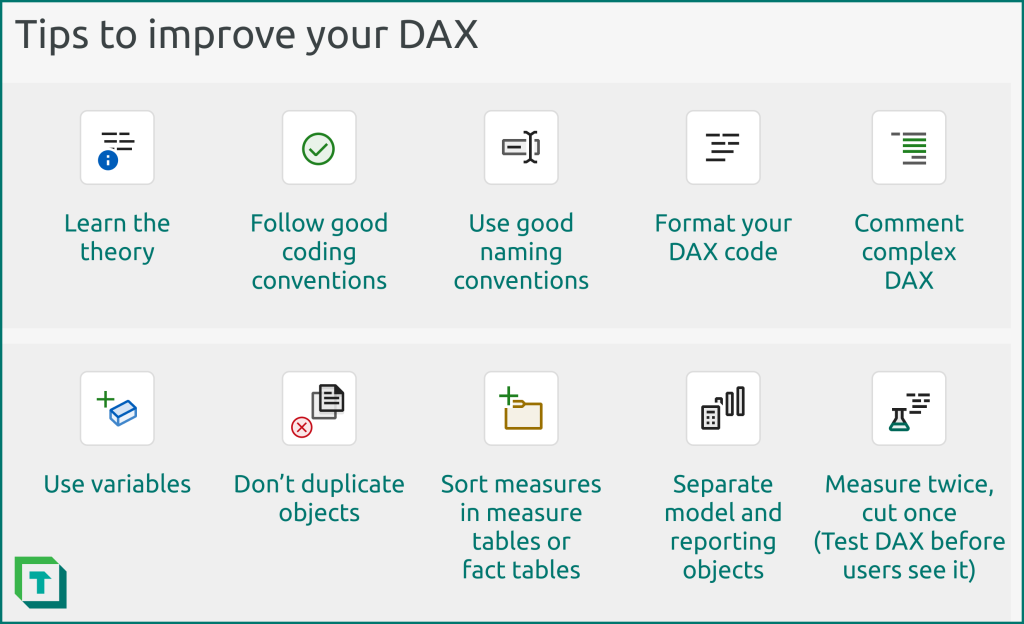
- Learn the theory; don’t just copy examples: Learning DAX is not easy. However, some core (albeit challenging) concepts underly the majority of complexity in DAX. If you focus on learning and applying these core concepts, writing DAX will be easier and faster. This is especially true if you use LLMs, which can provide complex code with subtle issues or defects that you won’t spot if you don’t understand the basics, unlike procedural programming languages like PowerShell, Python or C#, where such issues are more immediately apparent.
- Be consistent in code conventions: Use upper-case for functions and qualify column references with the table name (like ‘My table'[My column]) and don’t qualify measure names. If you create columns in temporary tables, prefix their names with “@” to avoid ambiguity issues.
- Use consistent naming conventions: Name measures, columns, and tables in a concise and logical way that complies with the terminology used by the business. Don’t over-use acronyms.
- Format your DAX code: This ensures that your code is readable and easier to maintain.
- Comment complex DAX: In multi-line, complex DAX, comment the code so it’s easier to understand and maintain. You can use LLMs to make this easier, but validate before you use the output. Also, when writing useful comments, focus on the “why” rather than the “what”.
- Use variables: Define variables that use clear and consistent names. Use them to avoid repeating evaluations (which makes code more performant) and to better structure your DAX expressions.
- Don’t duplicate objects: Try to be judicious in how many DAX objects you create, particularly avoiding duplicating measures that have identical logic or function. Instead, re-use existing code.
- Sort measures in measure tables or fact tables: Store measures together in a measure table for small models. For larger models with multiple fact tables, hide the fact table columns and store the measures here, instead. Organize measures in (nested) display folders so they’re easier to find.
- Separate model and reporting objects: Place any measures used for specific visuals and reports (like SVG measures or conditional formatting) in a separate measure table. Ensure that if the model will be used by self-service consumers that you hide these measures (or set the table to private).
- Measure twice, cut once: Ensure that you test DAX before you use it in a business-facing report. Validate your approach and ensure you test both data accuracy and performance. Avoid situations where the business sees wrong numbers or slow-performing queries at all costs.
Write DAX in your model
You can create DAX measures, columns, and tables in different ways with different tools. Each method has its own advantages and benefits. The following image depicts an overview of how you create DAX objects in your model or reports.
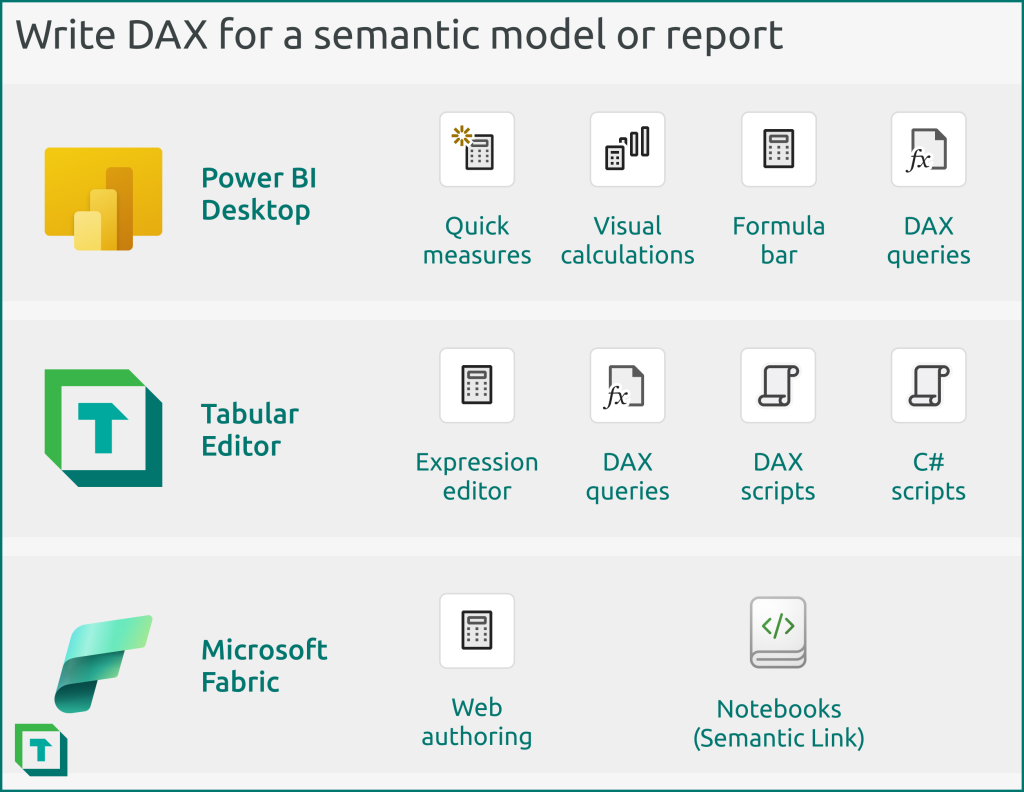
- General scenarios: Write DAX using any method that best appeals to your way of working and tools available.
- Advanced scenarios: We recommend that you use DAX queries, because you can define measures and validate them in queries, simultaneously. These queries can be saved and re-used for later testing and validation.
- Re-using DAX code or patterns: We recommend that you use programmatic approaches, like DAX scripts, C# scripts, or semantic link in notebooks. Learning this early will save you countless hours… and many headaches.
Power BI Desktop
In Power BI Desktop you have several options to write DAX. However, not all of these options support all objects.
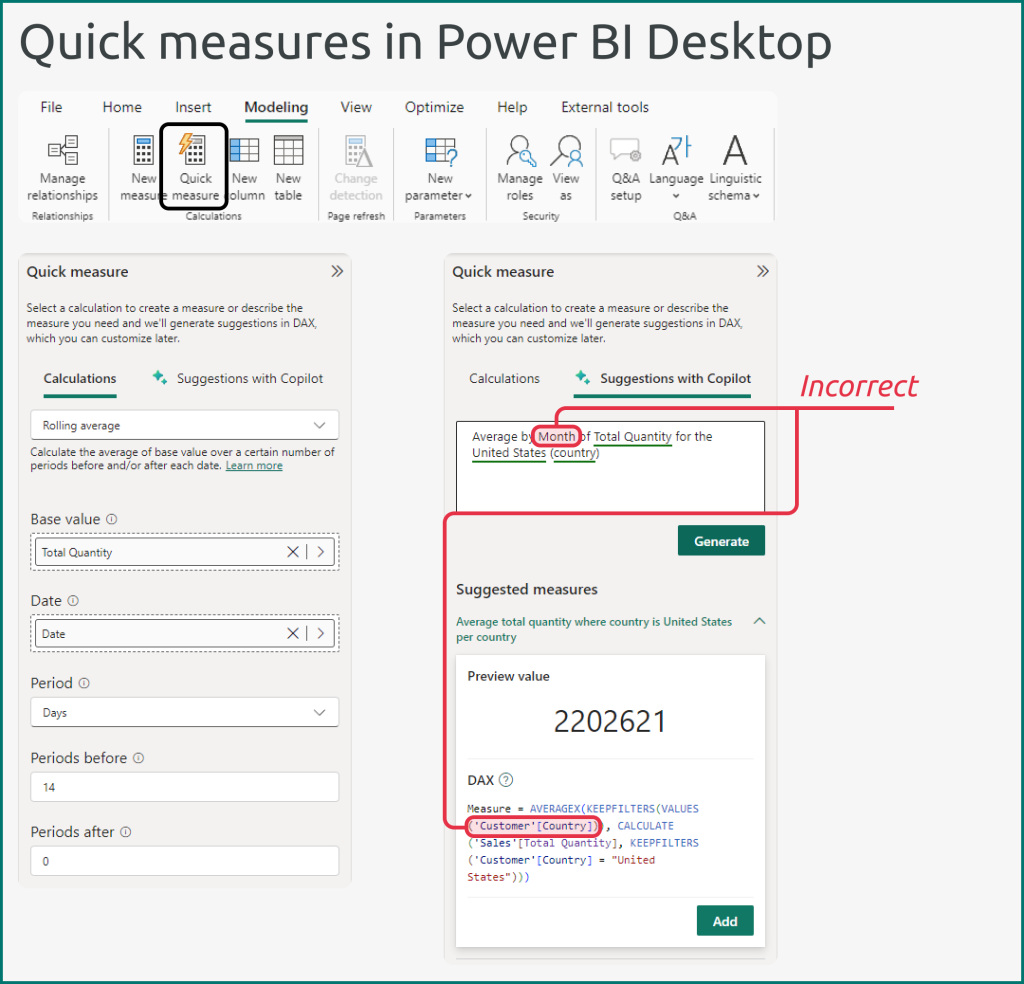
Quick measures
In Power BI, you can create quick measures when you want to write more complex DAX measures for common patterns. With quick measures, you select the fields you want to use and parameters for how you want to use them. The quick measure pane will then create the DAX measure for you in the model, and you can view and modify the resulting DAX.
Quick measures are very beneficial for business users and self-service users. When used in combination with implicit measures, quick measures can already cover a wide breadth of scenarios. However, even more experienced developers can benefit from quick measures to learn from the patterns and modify it themselves. In addition to the out-of-the-box quick measures, you can also request quick measure suggestions from Copilot. These suggestions use Q&A as well as generative AI (GPT3.5 LLM) to return suggested DAX code based on a natural language prompt that you provide. Quick measure suggestions can be a beneficial way to leverage generative AI, particularly if your model is well-organized with good naming conventions. However, the standard risks of using generative AI apply, such as ensuring that you vet and understand the code before you use it, to avoid that it produces incorrect or unexpected
Quick measures can be beneficial in scenarios like the following:
- New or inexperienced developers want to leverage common, existing patterns.
- Experienced developers want to learn from patterns they don’t often use, themselves.
- Experienced developers want to leverage some basic generative AI capabilities to write DAX.
Quick measures can have some general caveats to consider:
- You cannot create new quick measure patterns for yourself, your team, or your organization.
- The quick measures don’t provide comments in the code that explain how it works.
- Quick measures apply general patterns and might not work for your specific scenario.
- Quick measure suggestions with Copilot can be incomplete, incorrect, or misleading.
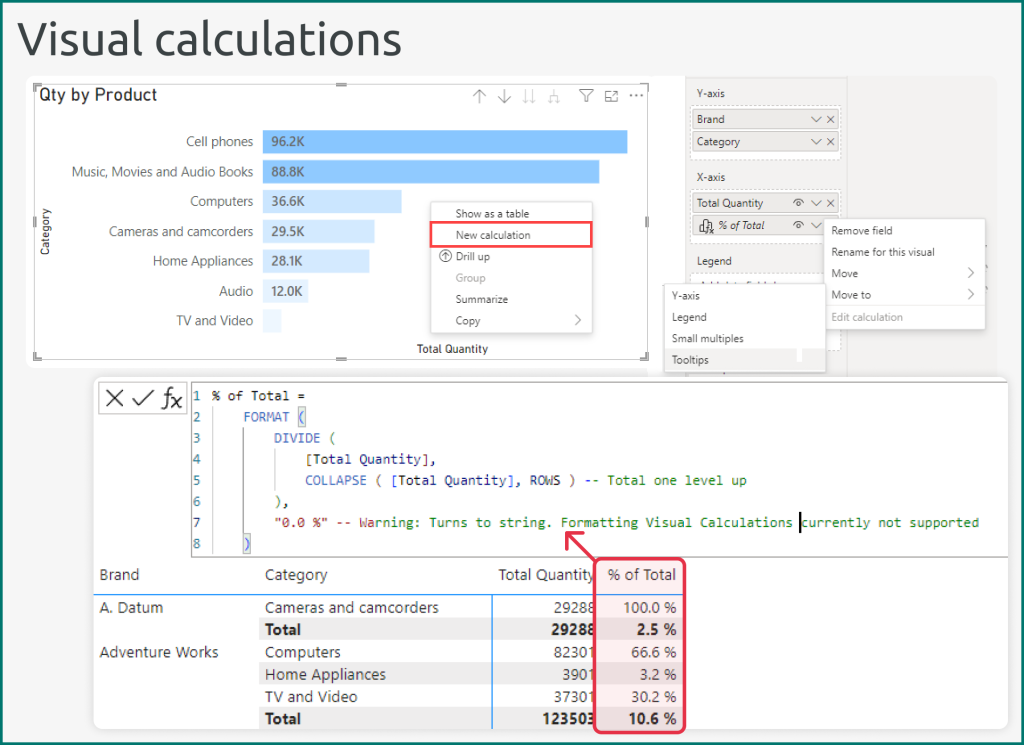
Visual calculations
Visual calculations are a new feature in the February 2024 release of Power BI to define DAX within a specific visual. With visual calculations, you create neither measures, calculated columns, or tables. Instead, you create a fourth type of DAX that is limited to the visual, itself. As such, you create visual calculations in reports, and not in semantic models.
Visual calculations are unique in that they have special functions that only work in that context, and they also only have access to the data in the visual (i.e. they cannot access the model).
To create a visual calculation, you can right-click a supported visual (like a line chart) and then define the calculation. Visual calculations can be useful for specific use-cases, and in some scenarios might even be faster than a standard model measure, since they operate on a dataset provided to the visual (and not the full semantic model).
Visual calculations can be beneficial in scenarios like the following:
- Specific scenarios that are easier in visual calculations, like ranking, referring to previous row, or moving averages and totals.
- Calculations that are specific to one visual and won’t be re-used elsewhere, saving space in the model.
- Calculations that are easier for you to develop or maintain in a visual than in a model measure.
Visual calculations can have some general caveats and considerations to keep in mind:
- Visual calculations use their own DAX functions and can’t access model objects (tables, columns, measures) that aren’t in the visual, which can be confusing for someone learning DAX for the first time.
- Visual calculations aren’t supported by all visual types.
- Calculations can change unexpectedly for a user, for instance when they change the sort order.
- Expressions for visual calculations are defined in the visual user interface or report metadata, which can make it harder to audit or govern by centralized BI teams in managed self-service scenarios.
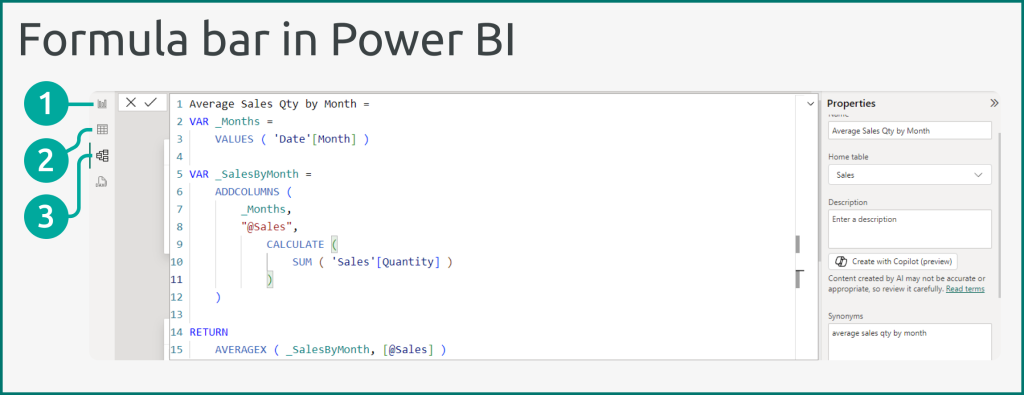
Formula bar
The formula bar is the default experience when you write DAX in Power BI. You use it for writing any expressions for measures or calculated columns and tables. You can view the formula bar and write DAX from the canvas, data, and model views.
- Canvas: Write measures here when you are viewing the change in expressions, iteratively.
- Data: Write measures here if you need to check values in a table (like for CALCULATE filter arguments).
- Model: Write measures here if you need to alter their properties (like description), simultaneously. From the model view, you can also access model properties and drag/drop (multiple) measures to folders (or tables).
The formula bar also has some additional helpful features.
- Autocomplete: Provides calculations and functions based on the initial text you provide.
- Syntax highlighting: Functions, variables, and comments are coloured differently than the rest of the code, and errors are underlined red.
DAX query view
Power BI also added the DAX query view in 2023, providing similar capabilities to the existing DAX query views in third-party tools like Tabular Editor or DAX studio. From this DAX query view, you can write DAX queries, where you can define query-scoped measures and later write them to the model. You can’t create calculated tables or columns from this view, although you can test calculated tables or columns here before you create them by using table expressions.
DAX queries in either Power BI Desktop or Tabular Editor are a good way to validate DAX as you write it by testing it for certain important dimensions, and comparing to a baseline. You can also re-use the query in other tools like DAX studio for optimizing performance, or to automate testing in Azure Pipelines (which is a service in Azure DevOps) or semantic link (which is a library in Fabric notebooks).
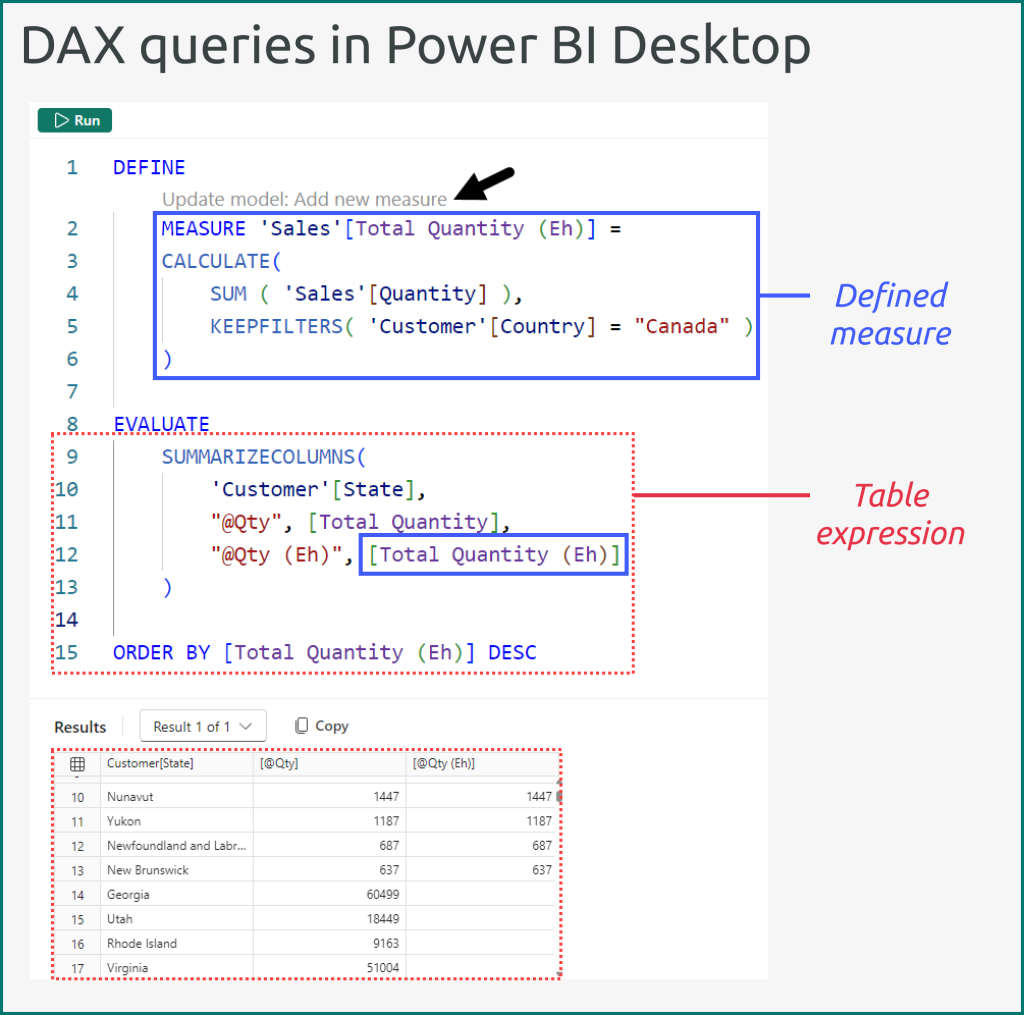
You can write your own queries from scratch, or right-click objects in the data pane to define “quick queries”. Additionally, you can copy queries from visuals by using the Performance Analyzer, which allows you to validate queries from reports. Any queries that contain measures will let you update the model by clicking a grey text above the defined measure. This lets you author DAX measures and queries to validate them, simultaneously.
Tabular Editor 3
Tabular Editor 3 is a tool designed to help you write better DAX more productively. This means that in Tabular Editor you have features to make writing DAX faster and easier. Furthermore, you can use the scripting in Tabular Editor to scale and automate a lot of your simpler DAX, letting you focus on the more complex calculations.
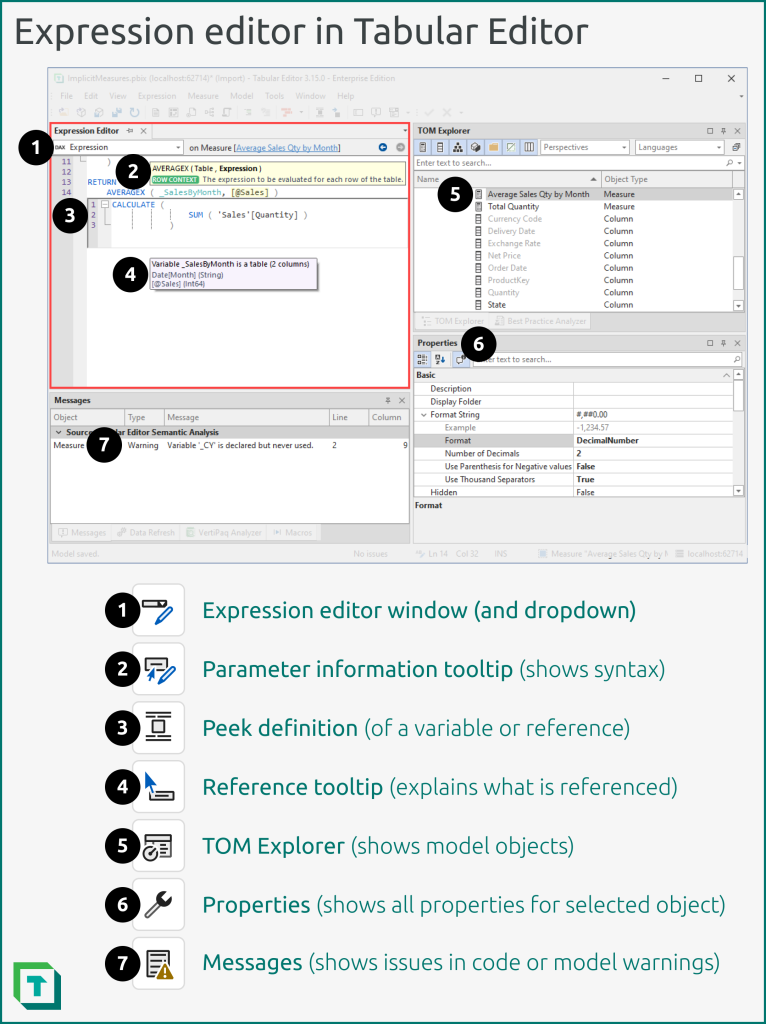
TOM Explorer and Expression Editor window
The simplest way to write DAX in Tabular Editor is by creating objects in the model, then defining the expression and properties in their respective windows. In the TOM explorer of Tabular Editor, you create objects either by right-clicking or using keyboard shortcuts. Since you work in disconnected mode, you don’t need to wait for any user interface updates before you start to write DAX.
You get the following benefits when you write DAX in Tabular Editor this way:
- You can press Ctrl + Z to undo any model or code change across any object.
- You can pop out the windows to move them elsewhere as you work. For instance, you can simultaneously see model properties, data previews, and query results.
- When your cursor is on a DAX function, you can press F12 to see its documentation.
- When you write DAX, a tooltip will tell you about important context like whether you are currently in an active row context or whether context transition occurs in the DAX you’re writing.
- You can peek definition or go to definition for referenced variables or measures, meaning you can check their expressions without navigating away from the DAX you’re writing.
- You can refactor variables (Ctrl + R) and text (custom shortcut: Editor.MultipleSelectAddEach) all at once.
- You can use the dropdown menu in the top-left to switch between expressions, such as a measure expression for its result and the dynamic format string expression for how the result is formatted.
DAX query window
Tabular Editor lets you author DAX queries, with similar capabilities to what were described above with Power BI Desktop. The following image gives an overview of what DAX queries in Tabular Editor look like.
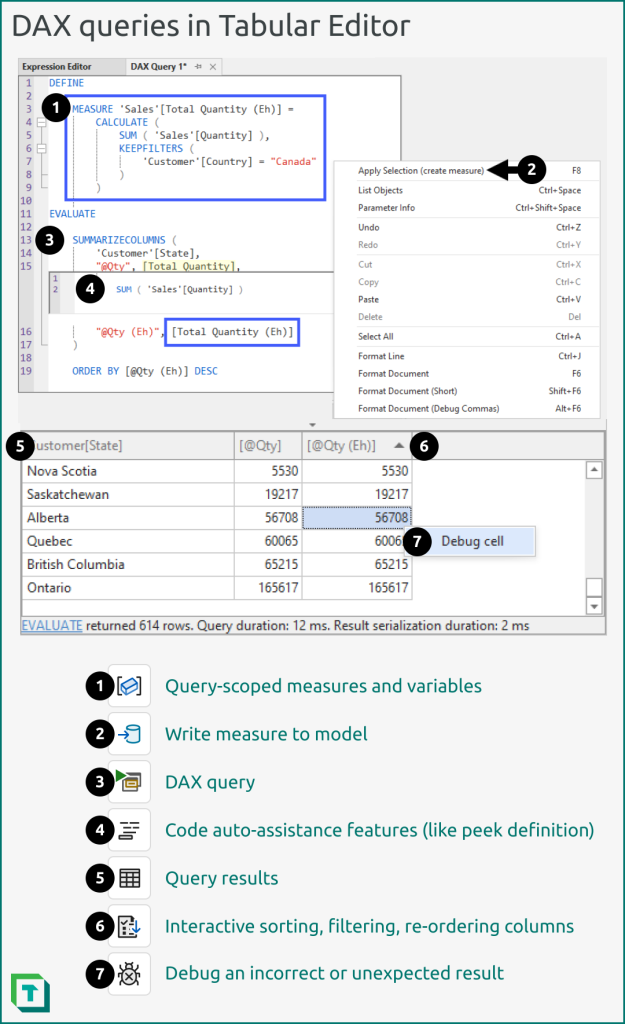
There are several key differences with the DAX query window in Tabular Editor and Power BI Desktop:
- You can pop out the DAX query window to place it elsewhere as you work on your model, letting you execute queries and write DAX as you perform other tasks.
- You can save DAX queries as .dax files, which can be used in other applications and workflows.
- You can use code assistance features in Tabular Editor that don’t exist in Power BI Desktop, like the Tabular Editor DAX Debugger, that lets you view intermediate evaluations and shows you the filter and row contexts.
- You can query remote models and aren’t limited to only local models. This is particularly valuable for larger models, or when you want to impersonate users and groups to test data security.
- You can interact with query results, performing dynamic column sorting, filtering, and search.
Otherwise, the guidance to use the DAX query window is identical to the query window in Power BI Desktop—use this view when you write advanced DAX and are testing (or exploring) your model.
DAX scripts
DAX scripts are a feature unique to Tabular Editor that let you write multiple DAX objects to your model at once. These scripts are a convenient way to replicate DAX patterns, such as common code that you re-use across different models. DAX scripts also let you edit multiple properties in your model at once, and require no additional programming languages (like C#) to use or modify, making them a convenient choice for people who want to re-use DAX but who don’t know programming languages to do this, themselves.
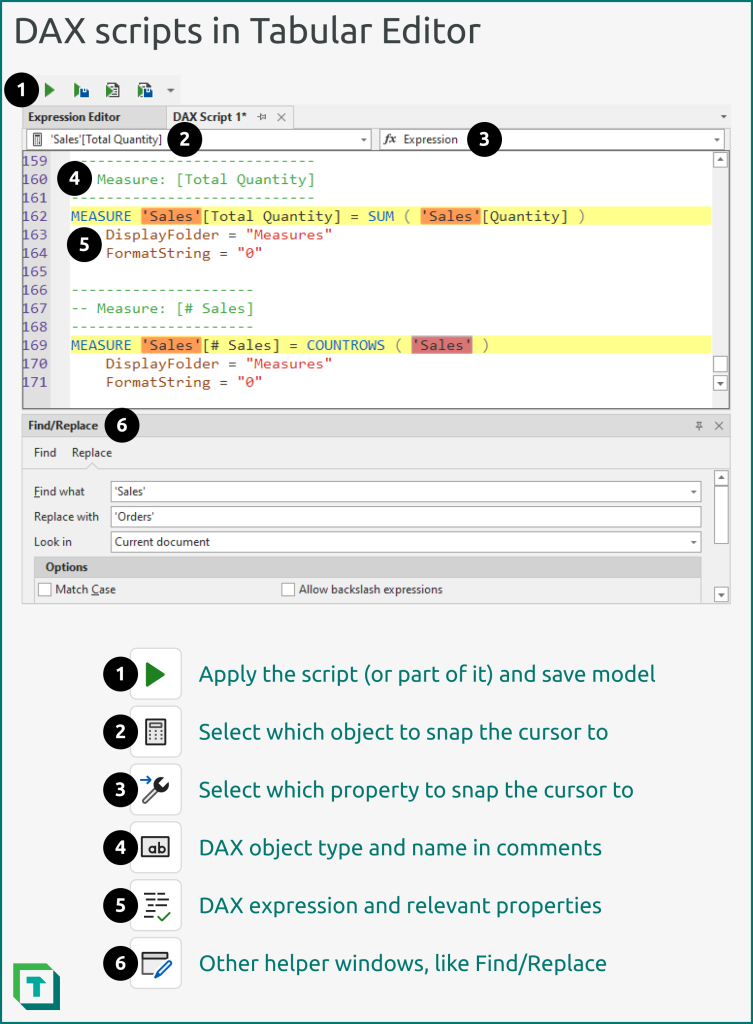
Creating a DAX script in Tabular Editor is easy. You simply right-click the parent object (like a table, or even the model) and select “Script DAX”. This generates the template for you, which you can immediately modify and write those changes to the model, or save to re-use in other models, later.
Use DAX scripts when you:
- Want to re-use DAX (use one script for each pattern).
- Want to edit the DAX expression and properties (like format string) at the same time.
- Want to perform a find/replace in multiple DAX measures (or other objects) at once, or you entire model. You can do this by right-clicking Model > Script DAX… and then pressing Ctrl + F to do a Find/Replace.
- Want to format all your DAX at once. You can do this by right-clicking Model > Script DAX… and then using the Format button.
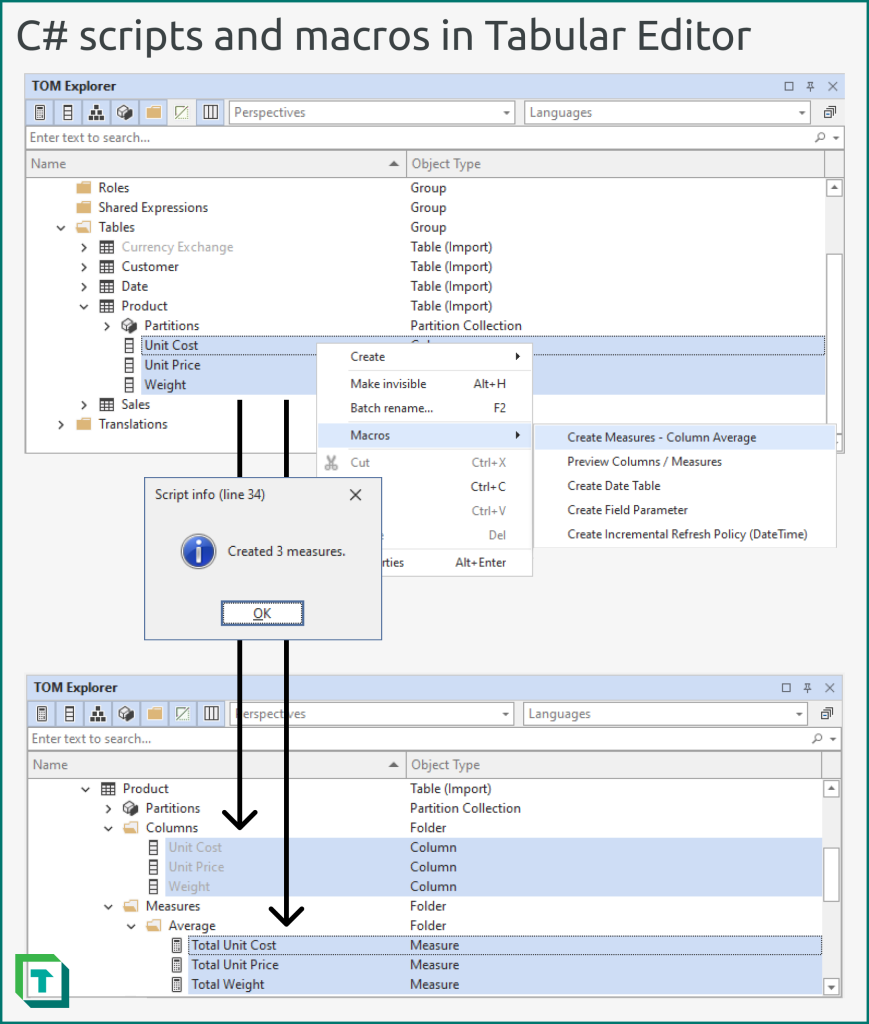
C# scripts
In Tabular Editor, you can programmatically modify your model (and write or evaluate DAX) by using C# scripts. These scripts use the C# language and various APIs so that you can write code that will automate or simplify DAX.
There’s many use-cases for C# scripts. In relation to model DAX, you use them for two purposes:
- Writing DAX: Scripts that create DAX objects or modify existing objects in your model.
- Evaluate DAX queries: Scripts that execute DAX and either use or show the result for a specific purpose.
Examples of C# scripting use-cases for writing or modifying DAX include:
- Creating initial model measures (like [Sales Amount]) that aggregate numerical columns.
- Formatting multiple (or all) DAX objects in your model at once.
- Creating DAX patterns for selected objects (like time intelligence for selected measures).
Examples of C# scripting use-cases for evaluating DAX include:
- Evaluating selected columns or measures to quick-preview them (instead of the whole table).
- Counting the rows of a selected table (or the unique values in a column).
- Counting null or empty string values in any columns that participate in model relationships.
Fabric
You can author DAX for semantic models by using Fabric either from a user interface by authoring your model in the web, or programmatically creating objects in Python with semantic link in notebooks.
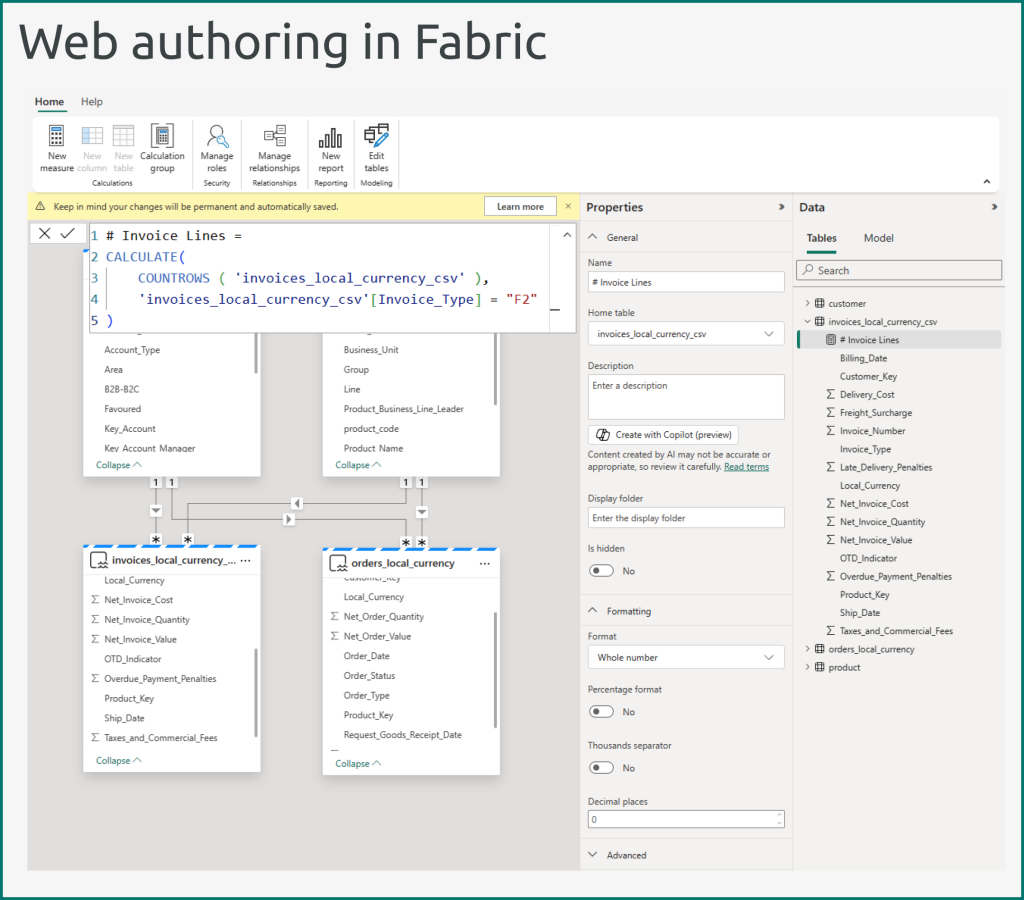
Web authoring
In Fabric, it’s possible to modify semantic models from the workspace. This is beneficial for users who don’t need the full capabilities of Power BI Desktop or Tabular Editor, or who can’t use these tools because they don’t have a Windows machine. You can perform all of the basic DAX authoring tasks in the web as you would in Power BI Desktop; however, these changes are saved automatically to the model.
There are some other key differences when you use web authoring:
- Changes are automatically saved (as stated before). You cannot undo changes; for example, if you delete a measure or table by mistake, you cannot undo this with Ctrl + Z.
- You can only access the “model view”; you need to open a connected report to validate changes in a report canvas by using Power BI visuals.
- You cannot enable preview features or modify certain configuration, like auto date/time.
- You cannot modify Power Query or shared expressions (custom functions or tables that aren’t loaded).
- You cannot write or evaluate DAX queries like in Power BI Desktop.
Generally, you should avoid web authoring unless you really need to use it, or because it’s really the most convenient option for you. The main reason for this is in Power BI Desktop or Tabular Editor, you can better track and manage changes, both for version control and better collaboration, and you have more complete access to the model and its features or properties.
Notebooks (Semantic Link and fabric_cat_tools)
If you have Fabric capacity, semantic link in notebooks allows you to programmatically engage with semantic models by using Python. There’s many possible use-cases for semantic link, including writing DAX and evaluating DAX queries. We gave an example of this in a previous article, where we explained how to use semantic link to validate relationships by evaluating DAX queries.
A recent library created and managed by Michael Kovalsky from the Microsoft Fabric Customer Advisory Team (CAT) called fabric_cat_tools extends this and makes it easier for you to programmatically read and write semantic models from a notebook.
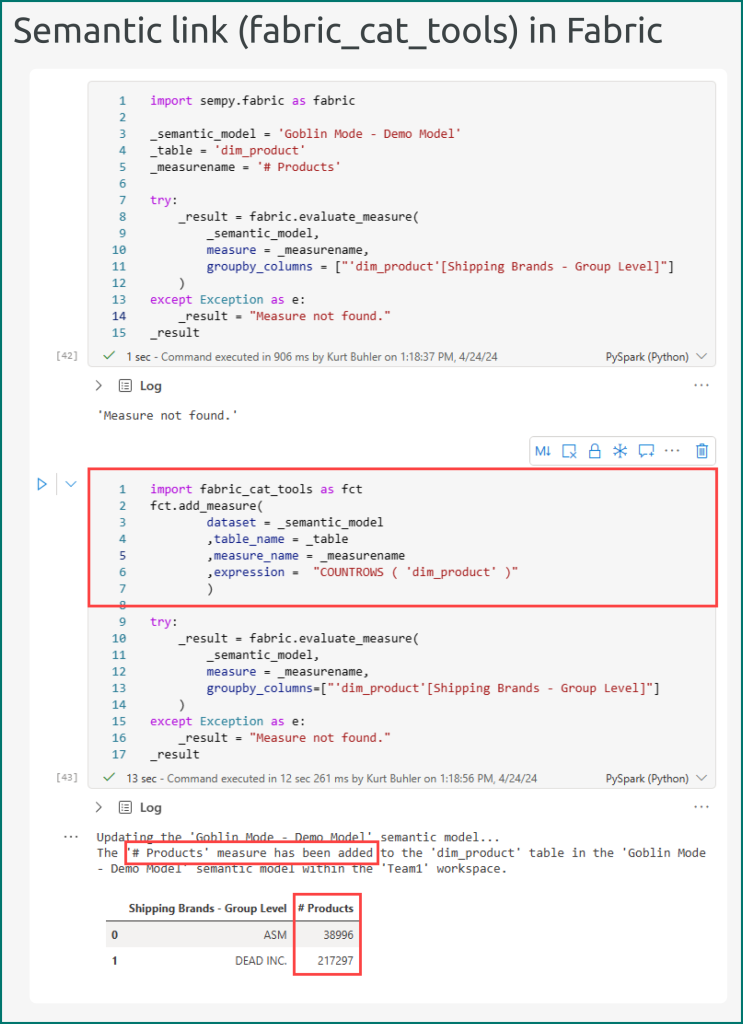
Using fabric_cat_tools this way can be a significant boon for repeating commonly used DAX objects and patterns, so that you aren’t re-creating them in new models, each time. With semantic link and fabric_cat_tools, developers who are familiar with Python will have a great and equally powerful alternative to Tabular Editor’s C# scripting.
Some possible caveats to using semantic link this way include:
- You require a workspace on Fabric capacity.
- You cannot perform context-sensitive actions (that depend on objects or part of the model you engage with in a user interface) unless you code them yourself in the notebook.
- You cannot work offline; you can only evaluate your notebook when connected to the internet.
In conclusion
Writing DAX is an essential part of creating your semantic model. Ensure that you follow some good practices as you write to help you save time and ensure that your code (and model) will be easy to maintain. Depending on your scenario and available resources, you write DAX with different tools. Choose your tool based on your preferences and needs; However, generally, you should use DAX queries for more advanced scenarios and use programmatic approaches for when you want to re-use code snippets and patterns.