Benefits and use-cases
Power BI provides a variety of ways to enable users with self-service analytics. For example, organizations can opt for a managed self-service BI model (instead of a centralized enterprise BI model). In this model, a Center of Excellence (COE) or central team of data professionals create and manage Power BI datasets. Business users consume these datasets from Power BI desktop, Excel, or other analytics workloads in Fabric (like notebooks, which are fantastic, by the way) to address business problems with data.
A managed self-service BI model presents several advantages, including fewer requests for the central BI team and a preserved truth in re-usable shared datasets. However, this model also requires additional effort for governance. For example, central teams should train users to improve their data literacy and monitor what content is created and how it’s being used. Another challenge for these central datasets is incorporating new data.
In this article, we explore how this challenge is typically addressed, and how composite models can be an appealing solution.
Enriching or combining centrally managed Power BI datasets
Business data needs are constantly evolving as the business strategy adapts to change. It’s common for business users to request new data in upstream data sources so that they can answer new problems. This can be a difficult scenario for central teams to manage as they seek to balance user enablement with risk mitigation. How can you be flexible and promptly give people the data they need, but do so in a way that is sustainable and doesn’t create potential governance or compliance issues?
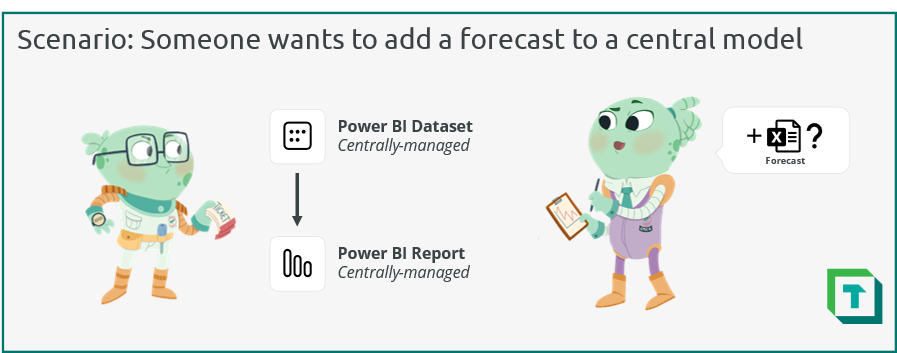
The following diagram depicts a common scenario where a business user wants to add a forecast (that’s specific to their business unit or region) to an existing, centrally managed dataset.
In this scenario, the central team managing the dataset has several options to address the request. However, none of the options are optimal for this team. These options either cost too much time or create too much risk. The following diagram illustrates three practical options.
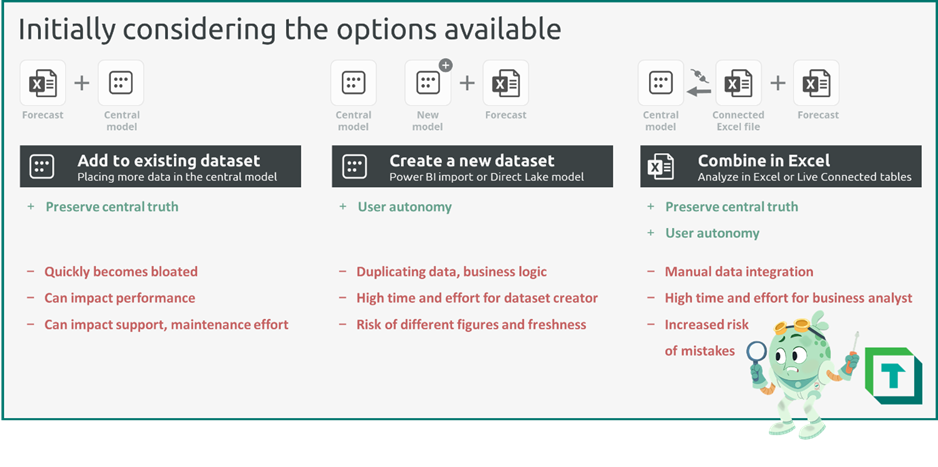
Before composite models, the team would have to do one of the following:
- Add the forecast to the existing dataset: The central team could integrate the forecast in the existing dataset or upstream data source. While a simpler option which does preserve the central truth, over time, this quickly can bloat the central model with dozens of niche sources. Adding additional data without discipline can be a slippery slope to performance issues and higher effort to maintain the model.
- Create a new dataset: The central team could create a copy of the original dataset that includes the forecast and only the data the user needs. Depending on their skill, the user themselves could manage this dataset. While this could enable the user without risking the central model, this approach poses obvious risks. There’s a high chance that the two datasets become out-of-sync, and creating and maintaining this second model will be a lot of effort. In general, duplicating data – or even just the business logic with DAX measures – risks poor outcomes.
- Combine in Excel: The central team could encourage the user to combine the data in Excel, leveraging Analyze in Excel or live connected tables. This maintains the central dataset, but the user is forced to combine the two sources manually in Excel, which has an elevated risk of mistakes and is a high effort investment. So, this option also isn’t ideal.
An additional option is to use Power BI composite models, which are generally available since April 2023. A composite model lets you enrich existing datasets with new data. This way, you preserve the truth and logic in central models, while still enabling users to add limited data to ask questions specific to them.
Use-cases for Power BI composite models
By using composite models, you opt for more of a customizable managed self-service model. That’s because the datasets are being customized by a small subset of content creators who want to add their own data. However, this customization doesn’t change the existing dataset, but only enriches it with new data and business logic so that they can address their data needs.
The following diagram illustrates several use-cases for composite models.
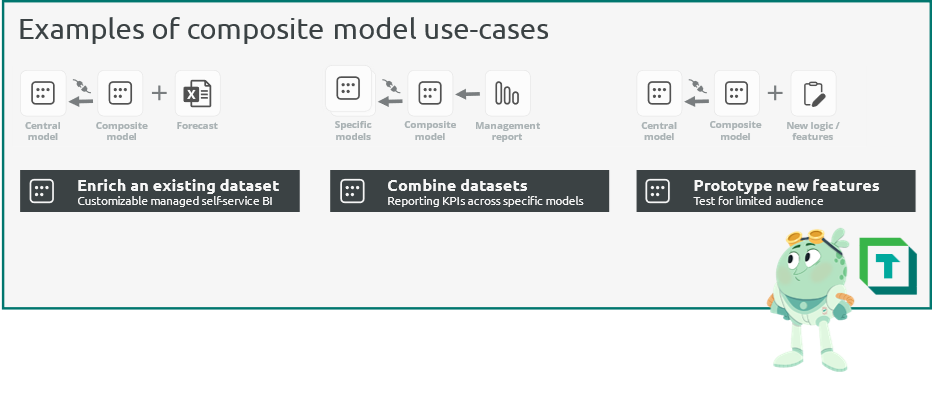
Composite models can be used in many different scenarios, such as:
- Enrich an existing dataset: The most common use-case of a composite model is to add new data to a centrally managed model. In this scenario, a more advanced self-service user connects to the dataset and adds additional data from other sources. Specific examples could be:
- Adding team-specific targets, like budgets, forecasts, or other examples.
- Using different master data, for example when performing point-of-sale or rebate analysis on sales data and aligning customer master data to your own transactions.
- Adding specific data not in scope of central models, like those of legacy systems that haven’t yet been integrated to a unified architecture.
- Combine datasets: With composite models, you can combine multiple datasets. This can be helpful to create high-level management reports, for example, which combine multiple KPIs across specific datasets.
- Prototype new features: By using a composite model to add new business logic to an existing dataset, the central team can prototype and test new features to specific target audiences, before including these features in the central model.
Additional information about use-cases is documented in the official Microsoft guidance for composite models.
Making the most of composite models
Composite models can provide many benefits. They help you preserve central business logic and data, while still enabling advanced users to do more with the dataset. That said, there are some key factors to consider using composite models successfully.
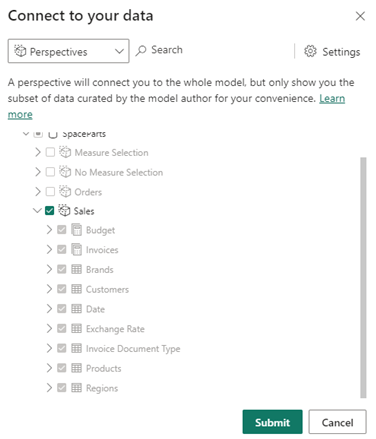
- Use perspectives: When creating a composite model, self-service creators have the option to select a perspective. Curating perspectives into common views helpful for consumers makes a more convenient experience. Furthermore, it can help you better leverage other features in Power BI, like personalize visuals. Personalize visuals is a helpful way to enable self-service analytics to users who don’t want the added hassle and complexity of creating new data and reporting items. You can create and manage perspectives in Power BI datasets by using Tabular Editor 2 or Tabular Editor 3.
- Select and train users to use it effectively: Given their implications and limitations, composite models require special attention for user enablement. Consider carefully who will benefit from this feature, and how you will train them to use it. Such a training should focus on the use-cases and limitations, and how to identify and handle the limitations. Additionally, ensure that central team members are aware of the special considerations for optimizing composite models. Read carefully the composite model guidance from Microsoft.
- Have useful, concise documentation: When connected to a composite model, users cannot see object definitions, like DAX formulas or Partition queries. This can create complex or frustrating scenarios for users who want to add their own logic, as they lack sufficient transparency of the underlying central model. In this scenario, there’s an elevated risk of the user creating erroneous or poorly performant code, despite their competence. To avoid this scenario, you should consider a way to improve the transparency of the model, such as exposing a data dictionary, documentation, or even having DAX expressions in the object descriptions. Useful ways to do these things can be with Tabular Editor C# scripting.
- Use dataset endorsement: Consider taking the necessary steps to improve the data discovery and democratization in your organization. Ensure that trusted, high-quality data sources are easy to find and recognize. A straightforward way to do this is by using the endorsement and discoverability features of Fabric, which make it easier for users to find datasets (for example in the OneLake Data Hub).
- Avoid unnecessary chaining of datasets: With composite models, it’s tempting to use them for all use-cases with potentially duplicated business logic or data. However, composite models have a variety of performance implications that can make this a poor choice. As with all design decisions, it depends on the data, the model, and the specific business logic in your scenario. Consider carefully all your available alternatives, like leveraging Power BI Dataflows for re-using conformed dimensions, or using the Master Model Pattern with Tabular Editor and scripting/automation to better manage re-used model logic.
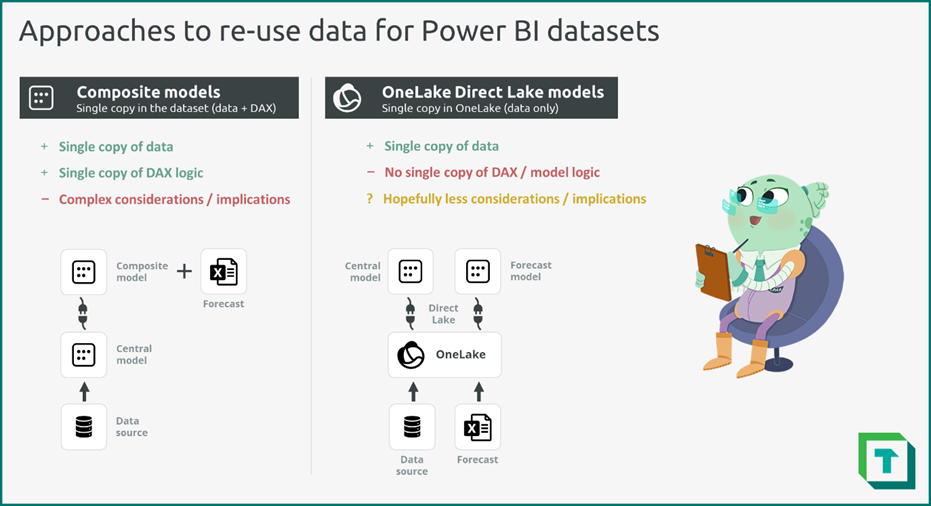
- Consider alternatives: With Microsoft Fabric, there are other alternatives to composite models. When you want to preserve a central truth while enabling users to add their own data, consider leveraging the “single copy philosophy” of OneLake. When Power BI datasets are using the Direct Lake storage mode and connected to the same data source, data is not being duplicated. This means you can create two Direct Lake datasets that use the same data, without duplicating that information. However, the business logic in DAX formulas and model relationships are configured in the datasets. As such, they’re still duplicated between the datasets, requiring careful management of this logic (for example, by using the Master Model Pattern mentioned in the previous bullet point).
As with any model design decisions, consider carefully the available options. Test these options before you apply them, weighing the pros and cons and their impact for your functionality, performance, and other relevant factors.
In conclusion
Composite models provide an elegant solution to a frequent problem: allowing end-users to incorporate new data, while still preserving central logic and truth. While there are key factors and implications to consider, leveraging composite models can be a useful option to enable advanced self-service users to do more with Power BI and Fabric.

I am exploring Composite Models for a use case as it seems like a good solution for what i’m trying to achieve.
My Composite Model contains many different existing semantic models. When i change one of the underlying models, I am not able to make the changes made in the underlying models visible in the Composite Model when connecting to it through TE3.
When I try to do the same in Power BI Desktop, the change made in the underlying models become visible immediately after hitting the refresh button. All refresh options in TE3 is disabled or greyed out when connected to a Composite Model.
Any idea on how to make the changes in the underlying models visible in the Composite Model in TE3?
Thanks a lot for the effort Morten. Much appreciated! 😀 Changing the connection in the shared expression worked for me. Thus, thanks again. However, it seems that I’m not the only one looking for a solution. That’s why I posted my way of doing here: https://community.fabric.microsoft.com/t5/Desktop/Changing-dataset-source-in-composite-model-without-re-importing/td-p/3184622 . Happy holidays!
Pingback: Gather Requirements for Semantic Models – Tabular Editor Blog
Hi Kurt,
I read this article and the one of Daniel (https://www.linkedin.com/pulse/composite-models-tabular-editor-daniel-otykier). What I’m looking for is a way to change the semantic model (dataset) the composite model is connected to. This is because I released a new version and needed all reports to use this new version. With a shared dataset and a live connection that is easily done. But that easy switch is not available with composite models. Thus, is there a way to change the Source Lineage Tag property via Tabular Editor 2? Thanks a lot.
Cheers, Dom
Hi Dom
Source Lineage Tag is a editable field so yes you can change it with Tabular Editor 2 or 3.
I have however never tried and cannot tell you what the effects are nor if it will accomplish what you are after. But in theory it should be possible to make this change, but you will probably have to experiment a bit so do keep good backups.
Thanks for the fast reply. To be more specific: Do you know what I do have to do in order to change to the Direct Query over Analysis Service connection? What fields I do have to change? I thought it is the Source Lineage Tag property. But I closer look into my file reveals that for every table there is a different GUID as Source Lineage Tag.
Hi Dom
Sorry for the delay in getting back to you.
This is really not something I have ever tried nor have knowledge of how to accomplish it.
I will ask around and let you know if I learn anything.
Hi Dom
So I might have an answer for you:
Composite model tables use a source expression to define the parent model. That expression needs a XMLA endpoint and a model name, and it is those that you need to change to point to the new model.
That is, in Tabular Editor you need to go to the TOM explorer navigate to the Expression folder and select the shared expression probably called DirectQuery over AS. The first function in that expression should look something like: Source=AnalysisServices.Database(XXX,XXX) and it is those two parameters inside the function you need to change.
Do be aware that there is no update schema funtionality for composite models so you would have to update partitions and table changes yourself. Finally, you may have to update the credentials in the service for the connection.